

Health Center
The Health center shows problems in your account’s own configuration and conversion delivery: a broken ad platform connection, conversions that stop reaching a platform, postbacks that keep failing, or a tracking domain that expired or stopped responding. Without it, these problems are usually noticed days later, once the campaign data is already wrong.
Checks run automatically in the background of the account. When you access the page, it always shows the problems that are open right now, and a row disappears on its own once the problem is genuinely fixed.
To access the Health center: log in to your account → in the top bar, click the Health center icon.

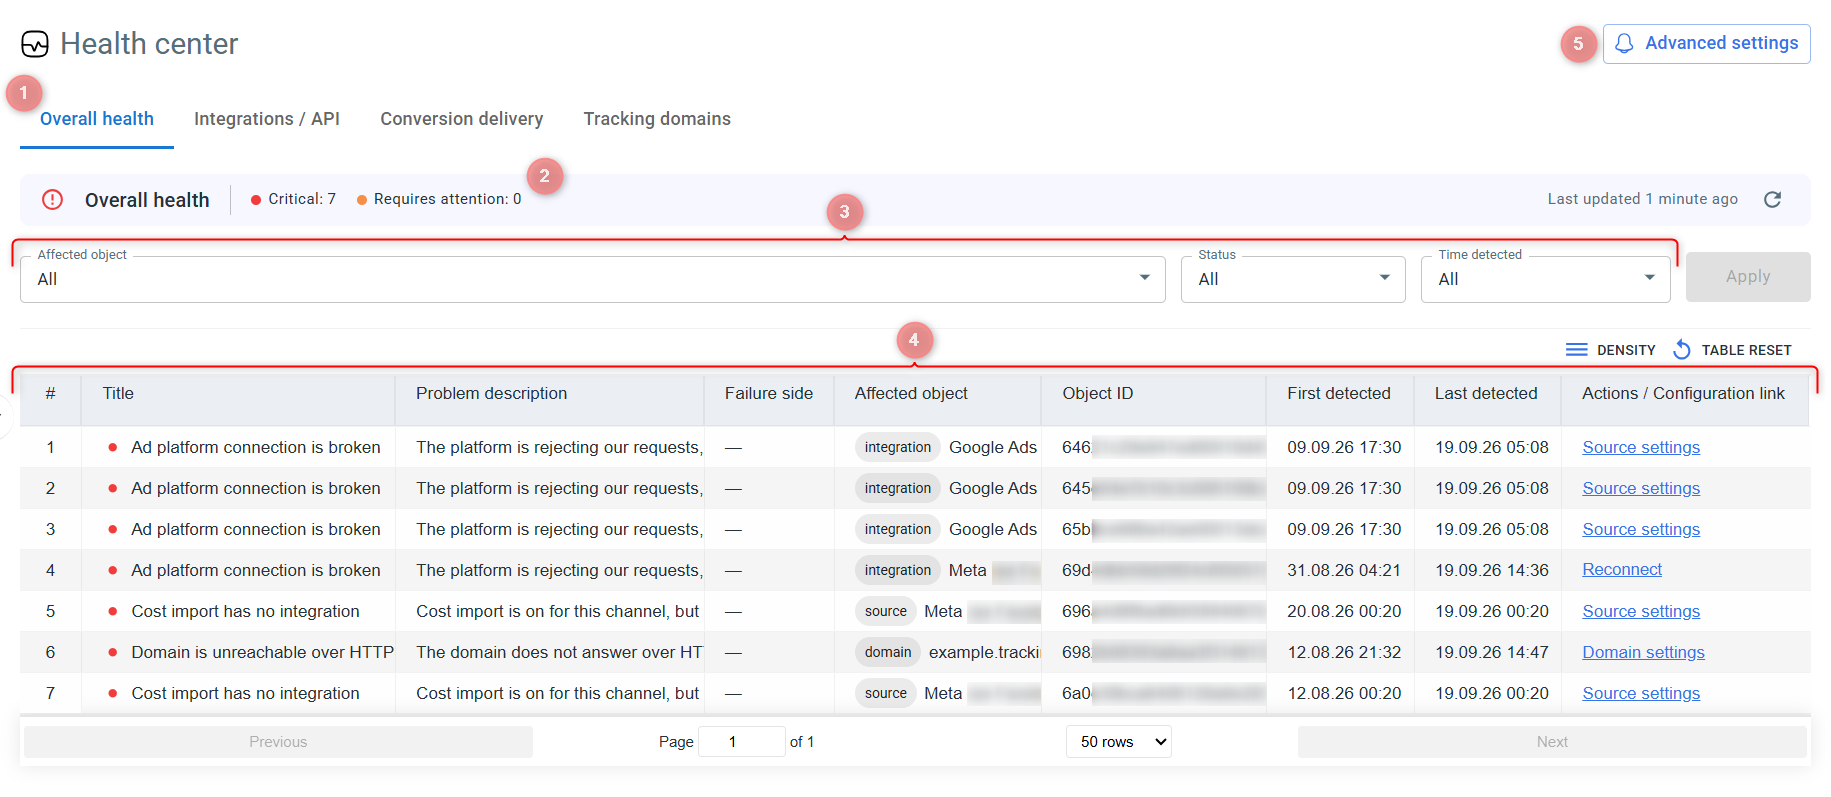
The Health center is divided into four tabs. Each one covers a different part of your setup, and everything on the page below (counters, filters and table) refers to the tab you are currently viewing.
- Overall health: shows every open problem on the account.
- Integrations / API: shows problems with connections to ad platforms and networks.
- Conversion delivery: shows problems with postbacks and conversions sent to ad platforms.
- Tracking domains: shows problems with domain availability, SSL certificates and domain registration.
The status summary bar tells you how many problems are currently open on the tab you are viewing, grouped by how urgent they are.
- Critical (red): something is already broken and is affecting your data.
- Requires attention (amber): something is about to break. Only the “expires soon” problems use this severity, such as a certificate or a domain registration approaching its expiry date.
The same colours appear as a dot next to each row, so you can tell at a glance how serious each problem is.
On the right side of the bar, Last updated shows when the page last fetched its data. Click the refresh icon next to it to reload the counters and the table.
Use the filters to narrow down the table:
- Affected object: the type of problem you want to see. The list changes according to the tab you are on.
- Ad platform: the ad platform the problem relates to. Available on the Integrations/API tab, and limited to the platforms connected to your account.
- Status: the severity, Critical or Requires attention.
- Time detected: last 60 minutes, today, yesterday, or the last 3, 7 or 10 days.
Select your values and click Apply.
▸The time filter matches on First detected, not on the most recent detection, so a problem that started last week will not appear under “Today”.
▸On the Conversion delivery tab, “Requires attention” is not available, because those problems are always Critical.
The table lists the problems that are currently open in your account. Each row is a single problem affecting a single object, such as a traffic source, an ad platform integration, a conversion pixel, a partner network or a tracking domain. If the same problem keeps occurring, RedTrack updates the existing row and refreshes its Last detected time instead of adding a new row every time, so the table stays readable even when a problem persists for days.
| Column | Description |
|---|---|
| Title | What went wrong, in short, for example “Ad platform connection is broken”. |
| Problem description | A fuller explanation of the problem. For conversion delivery problems, it also shows the failure rate and an example of the error returned. This is the same text you receive in your alerts. |
| Failure side | Whether the problem is on your side (Configuration) or on the receiving side (Partner endpoint). This helps you decide whether to review your own setup or contact the partner. Only conversion delivery problems use this column, so you will see a dash elsewhere. |
| Affected object | The type of object affected, followed by the name you gave it in RedTrack, so you can find it straight away. If the object has no active traffic source attached, the name appears empty. |
| Object ID | The ID of the affected object. |
| First detected | When the problem was first seen. |
| Last detected | When the problem was last confirmed as still present. |
| Actions / Configuration link | Where to go to solve the problem. Most rows take you to the settings of the affected object, such as Source settings or Domain settings. Some offer a direct action instead, such as Reconnect or Renew. |
Once you fix a problem, its row disappears from the table on its own. The Health Center always reflects the current state of your account, so solved problems are not kept anywhere.
Times are shown in the timezone of your computer, while your reports use your account timezone. If a detection time does not match what you see in a report, check this first.
Advanced settings is where you decide when conversion delivery counts as failing, which problems you want to hear about, and where those alerts are sent.
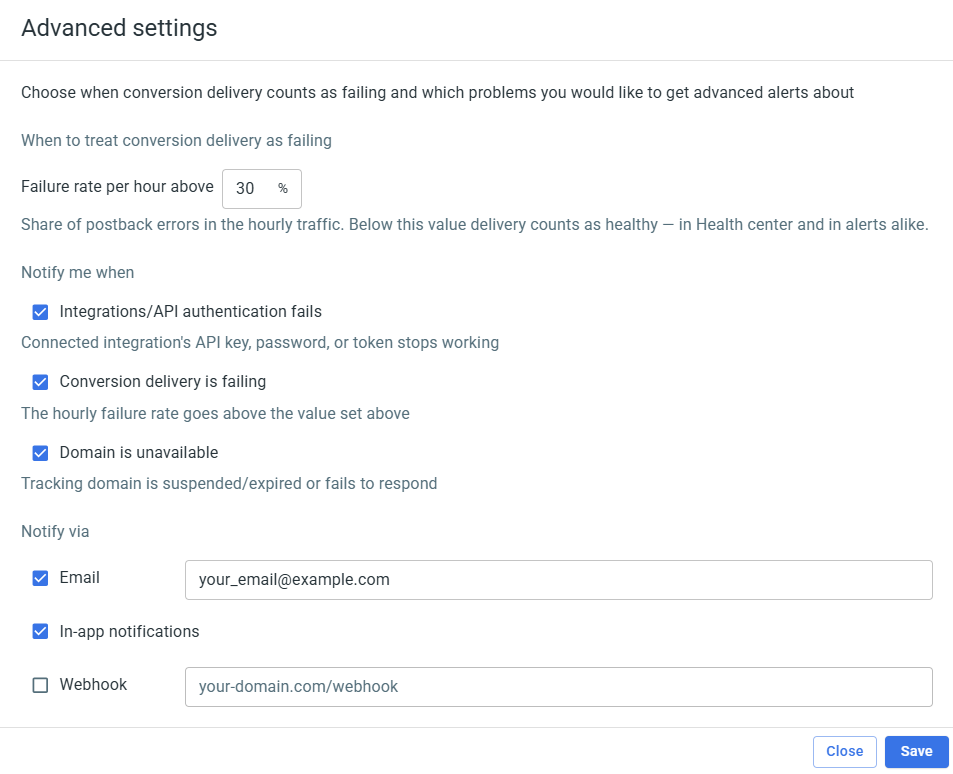
- Failure rate per hour above: the share of postback errors in your hourly traffic from which delivery counts as failing. Anything below this value is treated as healthy, both in the table and in your alerts. The default is 30%. Lower it if you want to be warned earlier, or raise it if your traffic produces a level of errors you consider normal.
- Notify me when: the types of problem you want to be alerted about, namely integration and API authentication failures, conversion delivery failures, and unavailable domains.
- Notify via: where your alerts are sent, by email, in-app notifications or webhook. If you leave the email field empty, alerts go to your account address.
Click Save to apply your changes.

