Campaigns report
Campaign report: overview
Campaigns Report in RedTrack provides a centralized dashboard to monitor the performance of all your marketing campaigns.
It merges traffic data (clicks, cost, impressions) with conversion data (leads, trials, subscriptions, revenue), giving you full-funnel visibility in one view.
Core features of the campaigns report:
- Performance overview: see how each campaign performs in terms of revenue, cost, conversions, and user activity.
- Funnel monitoring: track how users move from clicks to conversions using columns.
- Cost & ROI tracking: compare total cost vs revenue to evaluate campaign profitability.
- Traffic attribution: analyze performance by channel (e.g., Google Ads, Meta).
- Status monitoring: you can easily identify active, underperforming, or paused campaigns using visual indicators and color coding.
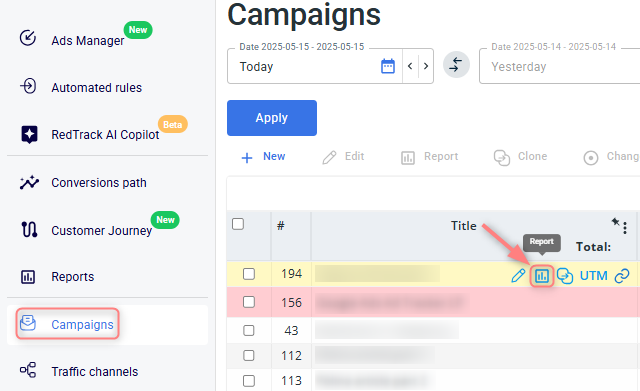
– To analyze a specific campaign in detail, click the Report icon next to the campaign you wish to explore.
Working with a specific campaign report
To get into the in-depth report for the selected campaign, act as follows:
1. Campaigns → navigate to the Report icon next to the target campaign:
2. Select the data slices → Apply:
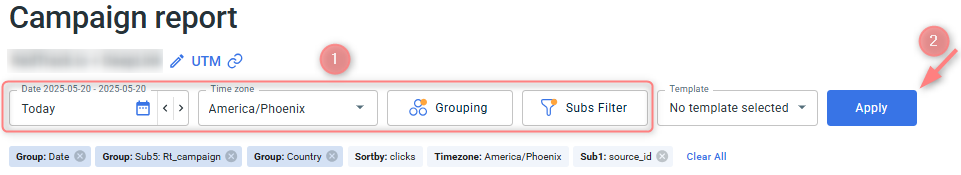
Choosing a specific date lets you define the time range for the data shown (e.g., today, yesterday, custom range).
Time zone alignment ensures reporting consistency across different geo targets.
This occurs because when the time zone in the report view is changed, the event timestamps are not converted to the new time zone. Instead, the system shifts the overall data distribution according to the selected time zone.
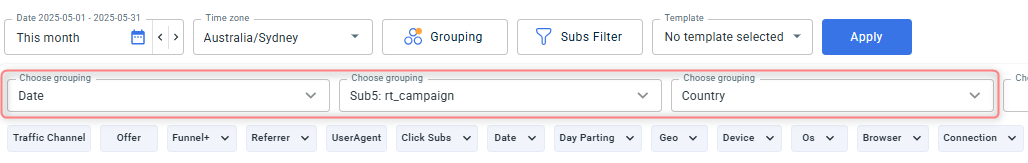
Grouping organizes your data based on the selected criteria within the chosen date range. For example, if you select “This month” as the date range and group by Date, you’ll see daily breakdowns. Each day will then display metrics grouped by the additional grouping options you’ve selected.
Use case
Set grouping:
Report data explained:
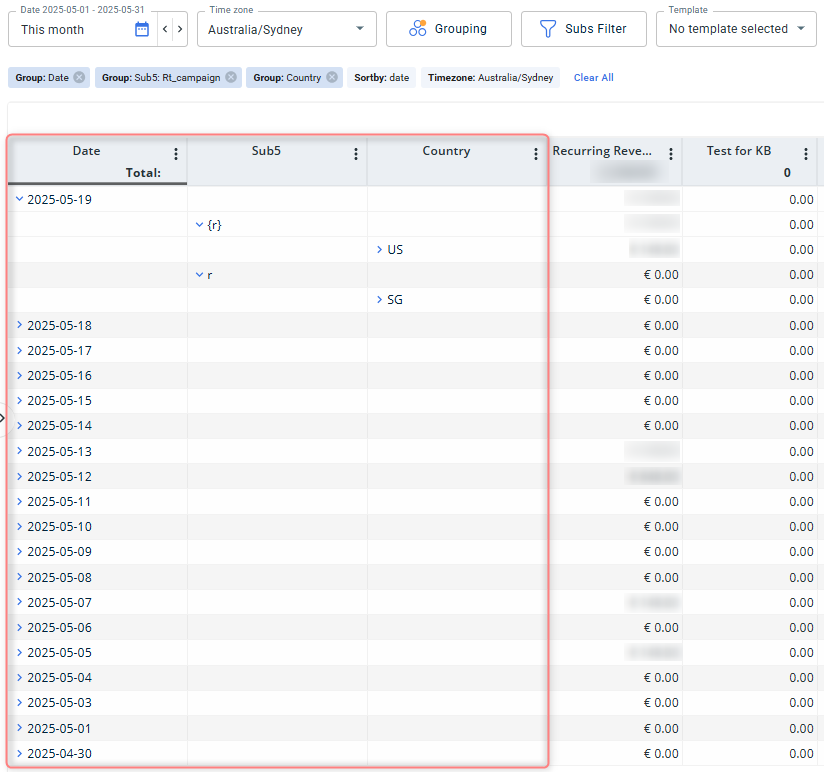
- Date: organizes the data by day (e.g., 2025-05-19).
- Sub5 (Rt_campaign): breaks down the traffic based on the value passed in the Sub5 tracking parameter.
- Country: shows performance segmented by users’ geographic location.
Interpreting color coding
Once you get the report, the data in it can be marked in different colors:
- Green highlights: high performance or positive return
- Red highlights: negative ROI or low performance
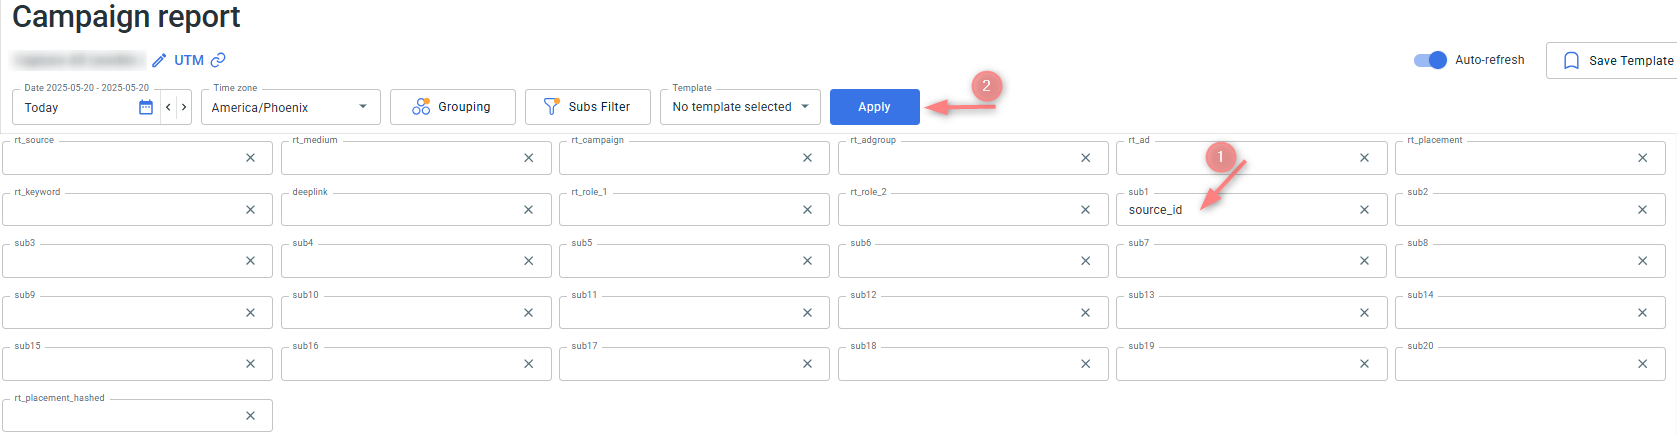
Subs refer to sub-parameters defined in the Traffic Channel template under the Additional Parameters section. To filter data by a specific sub-parameter, match the sub name you’ve set in the template (e.g., source_id, creative_id) to the corresponding sub field in the Subs Filter.
For example, if you placed source_id in sub1 in the Traffic Channel template, type source_id into the sub1 field in the Subs Filter to view data broken down by that value:
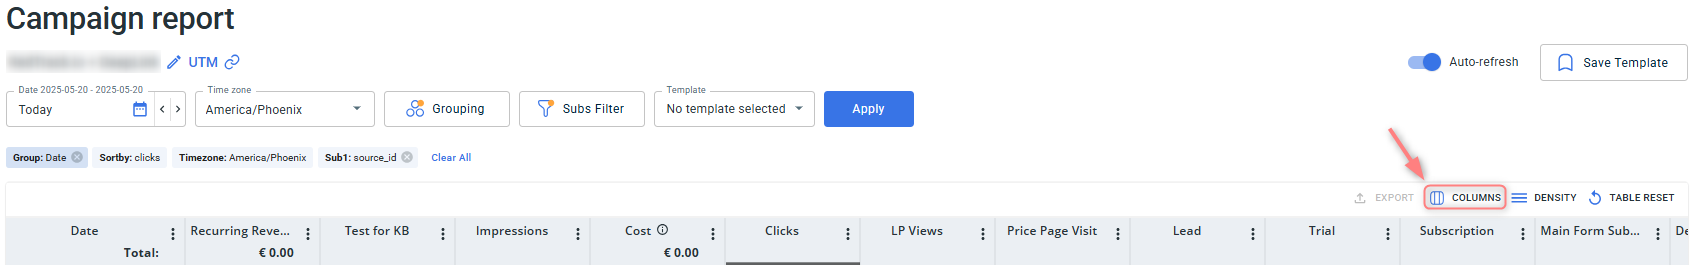
3. Personalize and optimize your report view:
You can choose which data columns to display in your report. To tailor the view to your needs, click the Columns button:
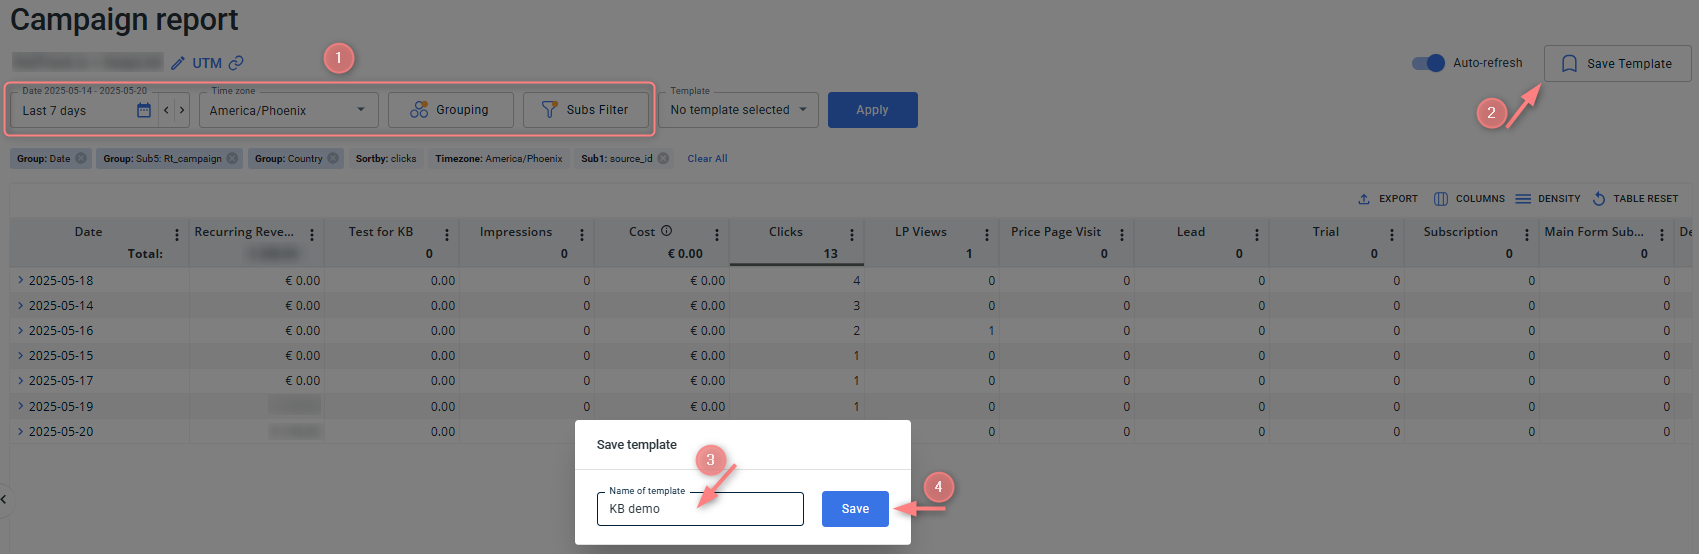
You can apply combinations of Date, Time zone, Grouping & Sub Filters, and save this configuration as a template.
It’ll help you save time when checking the reports regularly.
- To save the template, choose the needed combo of Date, Time zone, Grouping & Sub Filters → press Save Template:
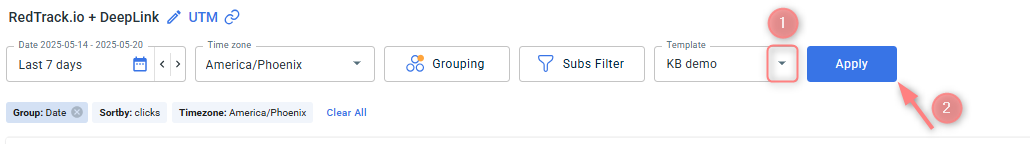
- To apply the template, select it from the Template dropdown → Apply:
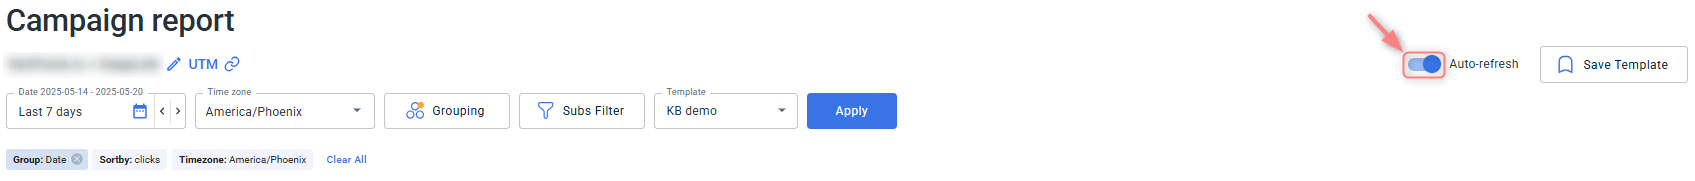
Use Auto-refresh when monitoring active campaigns to view live performance updates: