
Conversion path
Overview
Conversion path report in RedTrack shows you the most common sequences of touchpoints users take to complete conversions. It reconstructs the path leading to conversion by connecting interactions across traffic channels.
This report helps you understand how your marketing channels work together to drive results. Instead of looking at isolated reports from Traffic Channels, you can see the behavioral path that led to conversion. It shows the sequence of touchpoints that influence a customer’s decision, helping you identify which channels initiate, assist, or close conversions. These insights allow you to optimize budget allocation, refine retargeting strategies, and scale the most effective channel combinations with greater confidence.
How to work with the Conversion path report?
1. Go to Conversion path report → Select the Website → Choose the data filters: Granularity (source type), Conversion event, Date, Lookback period → Press Apply:
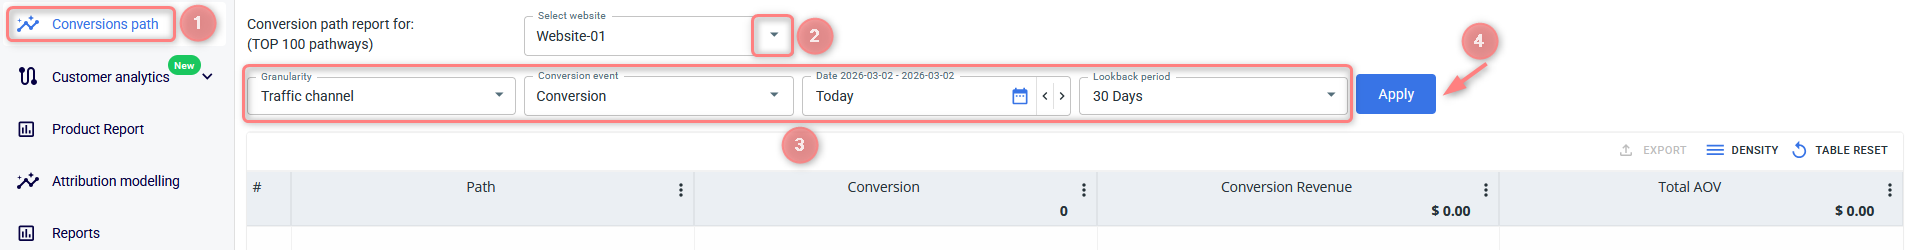
Filters explained:
Core granularity types explained:
- Source: traffic channel.
- Rt Source: parameter set in your traffic channel settings → “Additional parameters” section.
- Campaign: campaign which you created and launched to set the process of tracking in motion.
- RT Campaign: parameter set in your traffic channel settings → “Additional parameters” section.
- Entry page: this filter is still under development, but in the future, it’s going to be named Funnel and tracked correspondently.
For the events to be shown in this filter you need to add them first.
Add the filter by Date and Lookback period to get the data within the set period.
☛ In the Date filter, you sort out the data for a certain period.
☛ The Lookback period filter shows the statistics only within a certain chosen path. This data picker is set for 30 and 60 days.
30 days are granted by default. To get the 60-day filter, you must email [email protected] to upgrade your subscription plan.
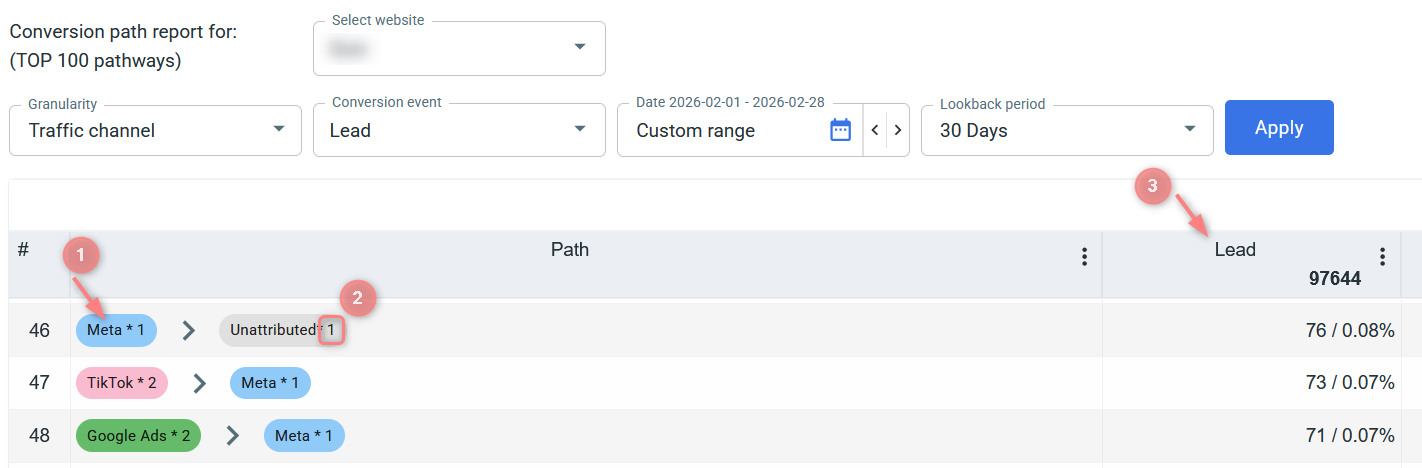
2. Once you see the report pay attention to the special markers:
Each traffic channel in the path is color-coded to make it easier to identify different sources:
- Green: Google
- Blue: Meta
- Light red: TikTok
- Grey: Unattributed / Referral / Other traffic channels
The numbers displayed next to traffic channels inside the path indicate the number of users clicking on this very page / choosing this conversion path. For example, in a path like Meta ×2 → Unattributed ×1, it means the user interacted with Facebook twice and then had one unattributed interaction before converting. These numbers represent the number of touchpoints within that specific path, not the number of users who converted.
The number displayed at the top of the conversion column represents the total number of selected conversion events within the chosen date range and applied filters. Each row then shows the number of conversions generated by users who followed that specific path, along with the percentage this path represents out of the total. For example, if the column shows Lead 97,644 at the top and a row displays 76 / 0.08%, it means that 76 conversions were completed by users who followed that exact sequence of touchpoints, and this path accounts for 0.08% of all conversions in the selected period.