
Attribution modelling
What’s an Attribution modelling report in RedTrack?
The Attribution modelling report in RedTrack helps you understand how different touchpoints contribute to your conversions and revenue. By applying different attribution models, you can analyze the customer journey and decide how to credit each channel or campaign based on your marketing strategy.
Currently, the Attribution modelling report in RedTrack:
- is available for all e-com subscription plans. If you’re an affiliate, contact [email protected] for more information.
- can be composed only for one conversion type at a time.
How to work with the report
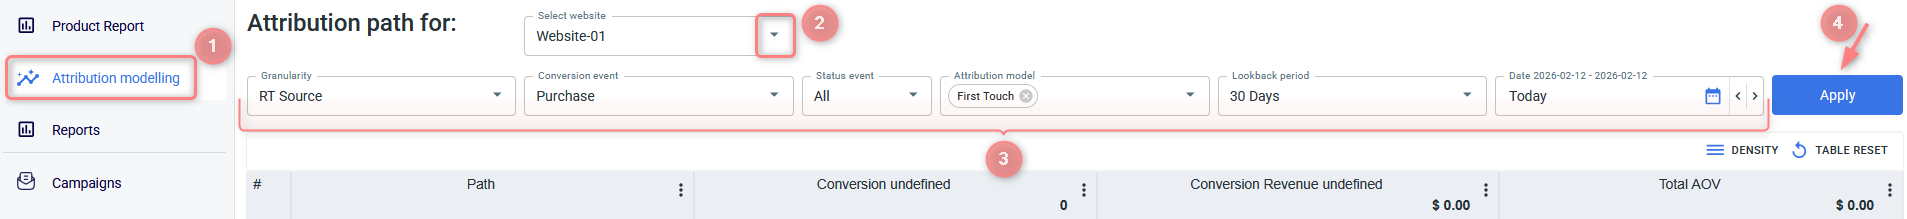
Go to Attribution modelling → Select the target Website → Choose the data filters: Granularity (source type), Conversion event (e.g., Purchase), Status event, Attribution model, Date, Lookback period → press Apply to generate the report:
Filters explained:
Granularity is the source type.
Core granularity types explained:
- Source: traffic channel.
- RT Source: parameter set in your traffic channel settings → “Additional parameters” section → the parameter with RT Source role.
- Campaign: the campaign that you created and launched to set the process of tracking in motion.
- RT Campaign: parameter set in your traffic channel settings → “Additional parameters” section → the parameter with RT Campaign role.
- Entry page: this filter is still under development, but in the future, it will be named Funnel and tracked accordingly.
For the events to be shown in this filter you need to add them first.
The status event filter allows you to segment your data by whether a conversion occurred for the first time for a given user (based on the clickid data) or is a repeat conversion.
This is especially useful when you’re running lead generation or subscription-based campaigns and want to distinguish between new and returning leads.
- New: a conversion is recorded for the first time with the selected conversion type for a specific clickid.
Example: Click ID 12345 → Conversion type: Lead → Status = New. - Repeated: it’s a conversion that occurs again with the same conversion type on the same clickid.
Example: Click ID 12345 → Conversion type: Lead → Status = Repeated (for the 2nd, 3rd, etc. conversion).
Attribution modeling in RedTrack is based on smart attribution combined with fingerprint tracking. You can choose between several attribution models depending on how you want to distribute credit across user interactions.
Let’s break down the models available:
| Attribution model | How it works |
|---|---|
| First Touch | Includes: all first clicks (organic or paid) via smart attribution + fingerprint. Attribution: 100% of conversions and revenue are attributed to the first interaction. Best for: evaluating top-of-funnel campaigns. |
| First Touch Paid only | Includes: only paid traffic, first clicks via smart attribution + fingerprint. Attribution: 100% conversion and revenue go to the first paid interaction. Best for: assessing the effectiveness of paid ads in starting user journeys. |
| Last Touch | Includes: all last clicks (organic or paid) via smart attribution + fingerprint. Attribution: 100% of conversions and revenue are assigned to the last interaction. Best for: understanding which touchpoint closes the sale. |
| Last Touch Paid only | Includes: only paid traffic, last clicks via smart attribution + fingerprint. Attribution: 100% of conversions and revenue are assigned to the last paid interaction. Best for: measuring the impact of paid channels in final decision-making. |
| U-Shaped | Includes: all clicks (organic or paid) via smart attribution + fingerprint. Attribution: ☛ 40% of credit to the first click. ☛ 40% of credit to the last click. ☛ 20% split between all other clicks in the middle. Best for: balanced insights into both first and last interactions. |
| U-Shaped Paid only | Includes: only paid clicks via smart attribution + fingerprint. Attribution: ☛ 40% of the credit goes to the first paid click. ☛ 40% to the last paid click. ☛ 20% shared among all other paid interactions. Best for: analyzing paid campaigns across the full funnel. |
| Linear | Includes: all clicks (organic or paid) via smart attribution + fingerprint. Attribution: evenly distributes 100% of conversion and revenue across all touchpoints. Best for: brands that want to give equal value to every interaction. |
| Linear Paid only | Includes: only paid clicks via smart attribution + fingerprint. Attribution: evenly distributes 100% of conversion and revenue across all paid interactions. Best for: evaluating the performance of paid channels across the entire journey. |
Use cases
By choosing different attribution models, you can check strategic insights into how users interact with your campaigns. Here are a few practical ways to use this filter:
- Analyze your full marketing mix:
Use the “First Touch” model to identify which channels drive first-time users to your site. This helps you understand which sources generate initial interest and how top-of-funnel activities perform. - Measure what drives conversions:
Switch to “Last Touch” to see which channels close the deal. This is useful for evaluating which campaigns or platforms drive final conversions and revenue. - Focus on paid campaigns:
If you want to analyze only your advertising efforts, select any of the “Paid only” models (e.g., First Touch Paid, Last Touch Paid, Linear Paid). This will exclude organic traffic and help you evaluate the true performance of your paid media investments.
To analyze your attribution data effectively, use both the Date and the Lookback period filters.
Date filter
The Date filter defines when conversions happened. It limits the report to show only conversions that occurred within the selected time frame.
Example: if you choose June 1 to 10, only conversions that happened during that period will appear in your report.
Lookback period
The Lookback period defines how far back RedTrack will search for user interactions (like clicks or visits) that led to those conversions. This filter affects how attribution is calculated by determining which touchpoints are included in the conversion path.
You can choose between 30 (default) or 60 days (extra).
Example: if a conversion occurred on June 10 and the Lookback period is set to 30 days, RedTrack will analyze interactions from May 11 to June 10 to determine attribution credit.