Product Report
Overview
Product Report helps advertisers analyze how individual products perform across all tracked campaigns. Instead of just seeing campaign-level results, you can evaluate performance product by product. With the help of this report, you can detect:
- Which products generate the most revenue.
- Which products drive profit, and which suffer losses.
- Where the users are dropping off (e.g., ViewContent but no Purchases).
- How ad spend correlates with product sales.
This report is especially useful if you sell multiple products and want to allocate your budget more effectively by focusing on the ones that deliver the best results.
Working with the Product Report
1. Make sure you’ve already added your Website, since this report shows how the products on that site are performing.
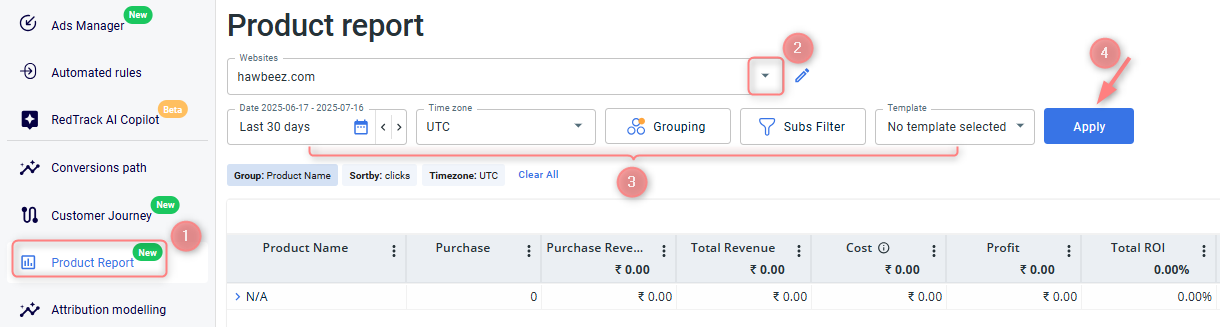
2. Go to Product Report → select the Website → choose the filters (how you want to break down the report) → Apply:
Choosing a specific date lets you define the time range for the data shown (e.g., today, yesterday, custom range).
Time zone alignment ensures reporting consistency across different geo targets.
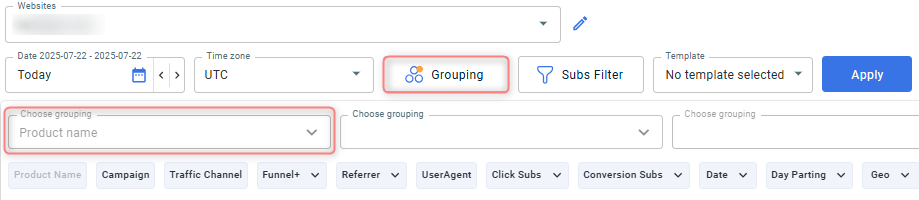
Grouping organizes your data by the selected criteria within the specified date range.
Product name prerequisites
1. You can customize up to 4 different grouping slices except for the first one. The first grouping option is always set to Product name by default. This can’t be changed, as the report is designed specifically to analyze performance by product:
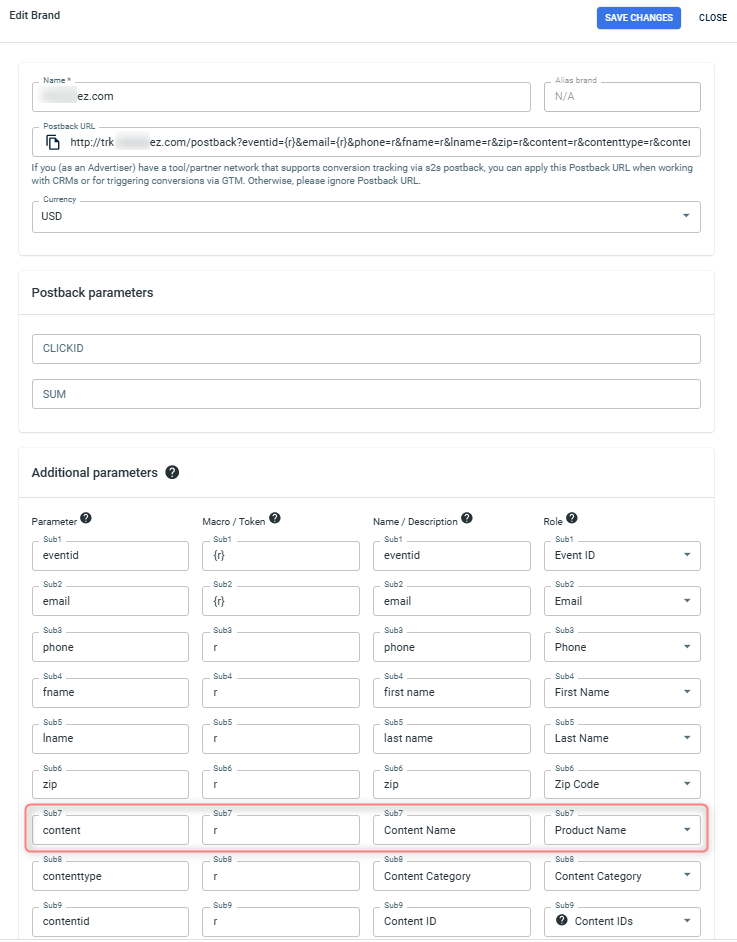
2. For the Product name to appear in the first column, you should make sure you added the required parameter to the Brand settings.
Go to Brand settings → Additional parameters → add the sub named “content” and assign the role “Product Name” to it → Save changes:
Parameter | Macro / Token | Name / Description | Role |
content | r | Content Name | Product Name |
Use case
Grouping set:
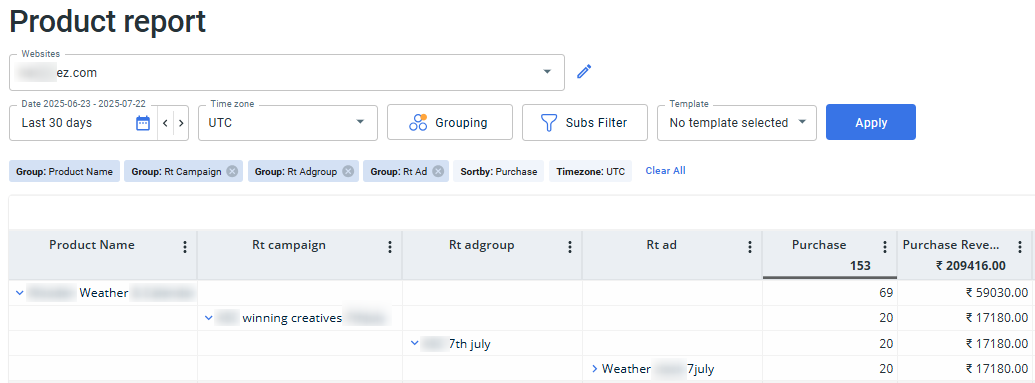
Report data explained:
This Product Report shows how the “Weather” product performed across campaigns, ad groups, and ads during the selected 30-day period on the website “ez.com”. The product is grouped first, and then broken down by each campaign it appeared in. Within each campaign, you can see the related ad groups and specific ads that helped generate sales. For example, the campaign “winning creatives” brought in the highest number of purchases, with 69 sales in total, 20 of which came from the ad group “7th july” and the ad “Weather 7july”, generating 17,180 in revenue. This view helps you understand exactly where your sales are coming from, so you can identify your best-performing campaigns and creatives, and adjust your strategy accordingly.
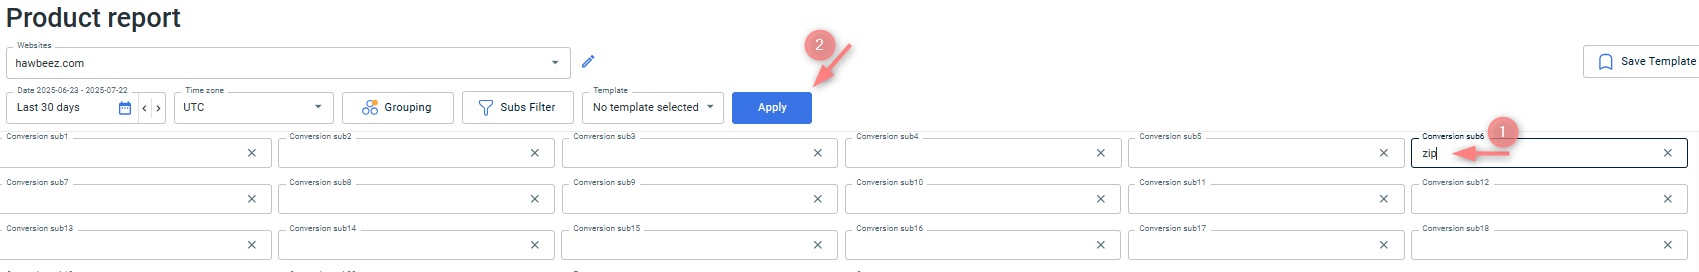
Conversion sub(1-20) refers to subs defined in the Brand template under the Additional Parameters section. To filter data by a specific Conversion sub(1-20) parameter, match the additional parameter name you’ve set in the Brand template to the corresponding Conversion sub(1-20) field in the Subs Filter.
For example, if you placed zip in sub6 in the Brand template, type zip into the Conversion sub6 field in the Subs Filter to view data broken down by that value.
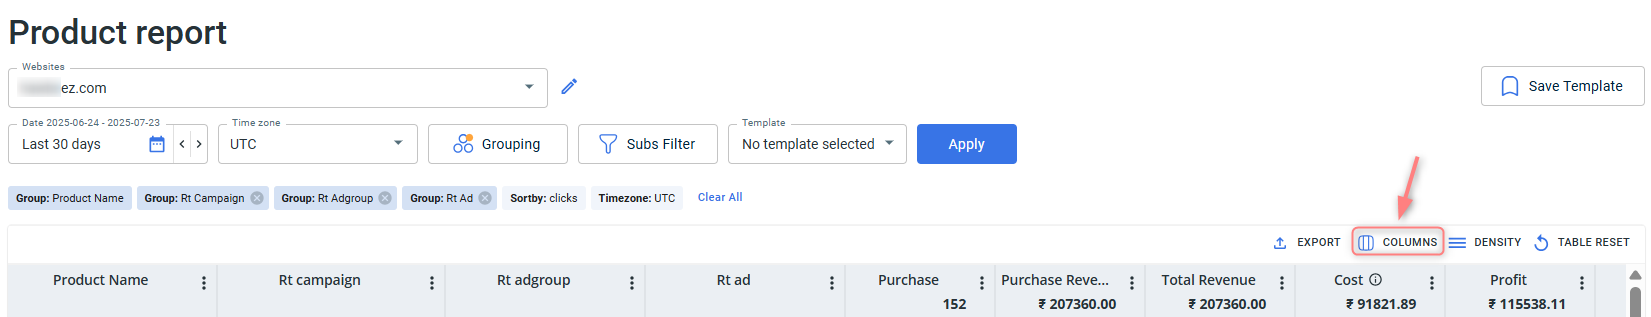
3. Personalize and optimize your report view:
You can choose which data columns to display in your report. To tailor the view to your needs, click the Columns button:
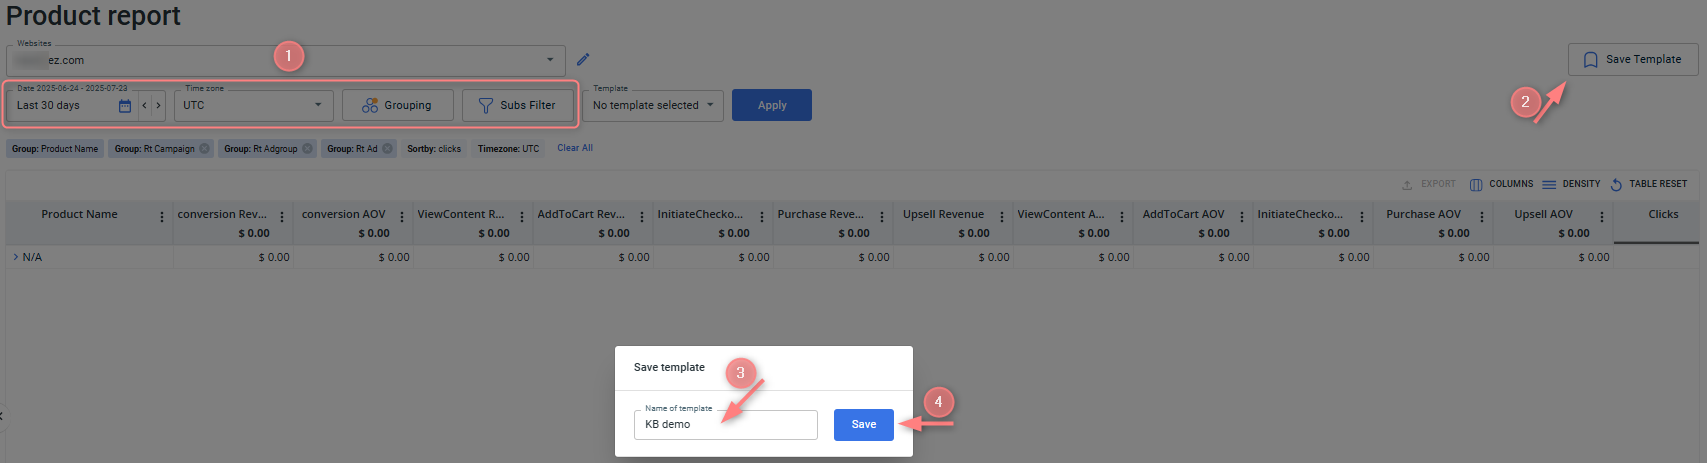
You can apply combinations of Date, Time zone, Grouping & Sub Filters, and save this configuration as a template. It’ll help you save time when checking the reports regularly.
- To save the template, choose the needed combo of Date, Time zone, Grouping & Sub Filters → press Save Template:
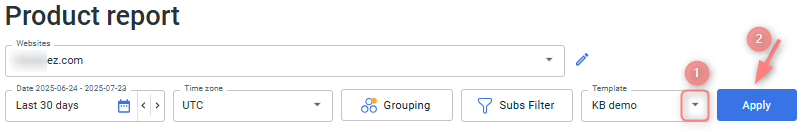
- To apply the template, select it from the Template field → Apply: