
Cohort Analysis
Overview
Cohort analysis is a report that shows how different customer groups behave over time after their first purchase. By tracking each cohort over specific time periods, you can analyze customer retention, repeat-purchase behavior, revenue growth, lifetime value (LTV), and changes in spending patterns. This approach makes it easier to compare new and returning customers, identify long-term trends, and evaluate the impact of marketing, product, and retention strategies.
The Cohort Analysis report is generated using the selected brand’s customer database.
How to enable the Cohort Analysis
To ensure accurate cohort analysis reporting, the following conditions should be met:
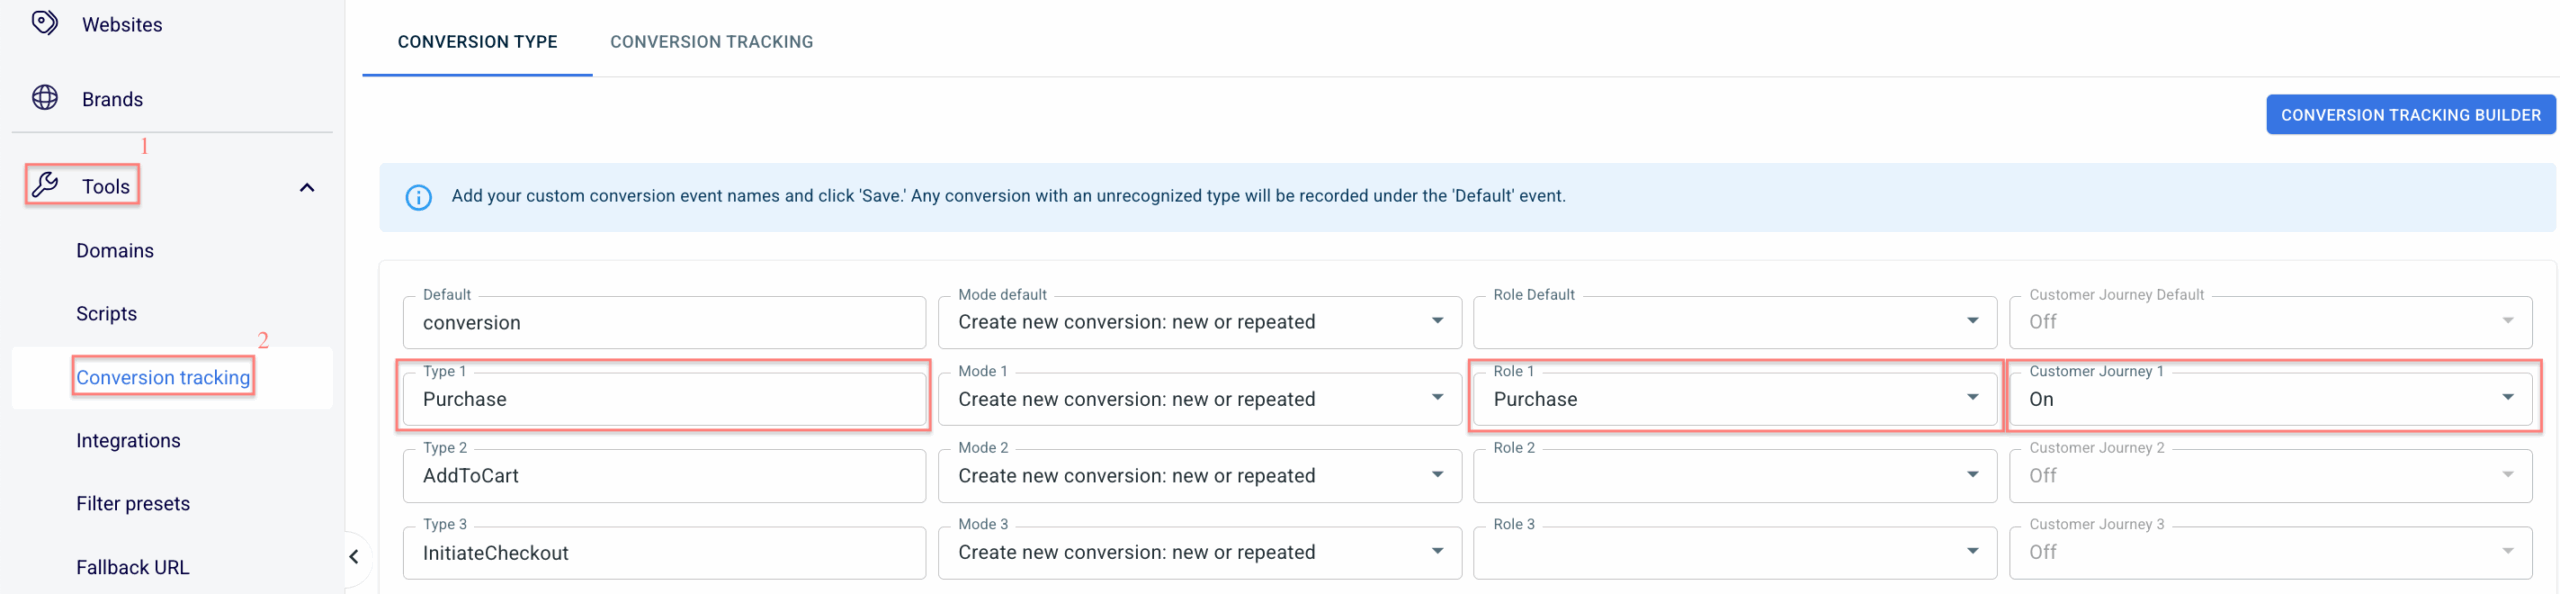
1. A Purchase is defined correctly.
It must be tracked as a conversion with the Purchase role assigned in the conversion types settings. Only conversions marked as purchases are included in cohort calculations.
2. Customer Journey feature is enabled for the selected conversion type.
This allows the system to track customer activity over time and associate events with the correct cohort.
How to work with the Cohort Analysis
Go to Customer analytics → Cohort analysis → select target Brand → fill in the filters → Apply/ Refresh:
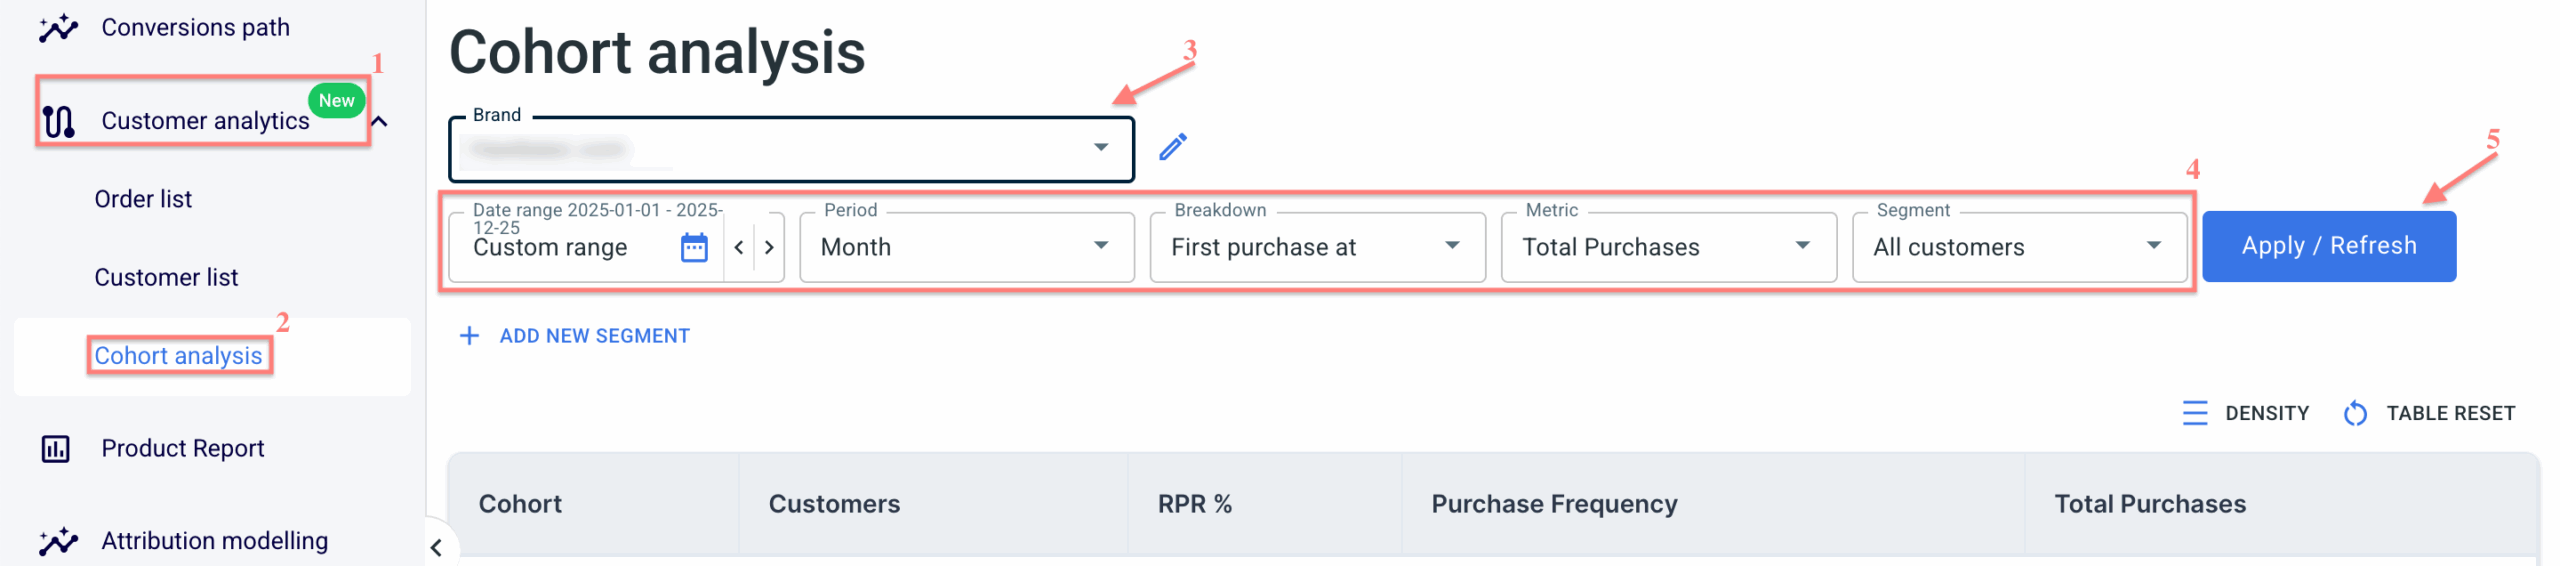
Filters explained:
The Date Range filter defines the Cohort Period — the time range during which customers made their first purchase and were grouped into a cohort.
The Period filter defines how the data in the report is grouped and displayed over time. You can choose to view customer behavior by day, week, month, quarter, or year.
Selecting a shorter periods (e.g., days or weeks) provide more detailed insights, while more extended periods (e.g., months, quarters, or years) offer a broader view of long-term trends.
The available option is “First Purchase At”, which groups customers based on the date or period when they made their first-ever purchase.
The Cohort Report can be built using one of four key metrics:
1. Total Purchases shows the total number of orders made by customers in a cohort over time.
2. Total Revenue presents the total amount of money generated by that cohort.
3. Lifetime Value (LTV) represents the total amount a cohort has spent from their first purchase through the selected period.
4. Average Order Value (AOV) shows the average amount spent per transaction by the cohort.
The Segment filter narrows cohort data to a specific audience. By default, all customers are included, but custom segments can be created to focus on particular groups or behaviors (e.g., new vs. returning customers, specific countries, or customers with a certain number of purchases).
How to create a new segment:
+ Add new segment → enter the Title → select the necessary fields → Save.
A new segment will appear in the Segment filter.
Overview of metrics in the table
This table displays the key metrics used in the Cohort Analysis report. Each value reflects how a customer cohort performs over time based on the selected metric, filters, and segment settings.
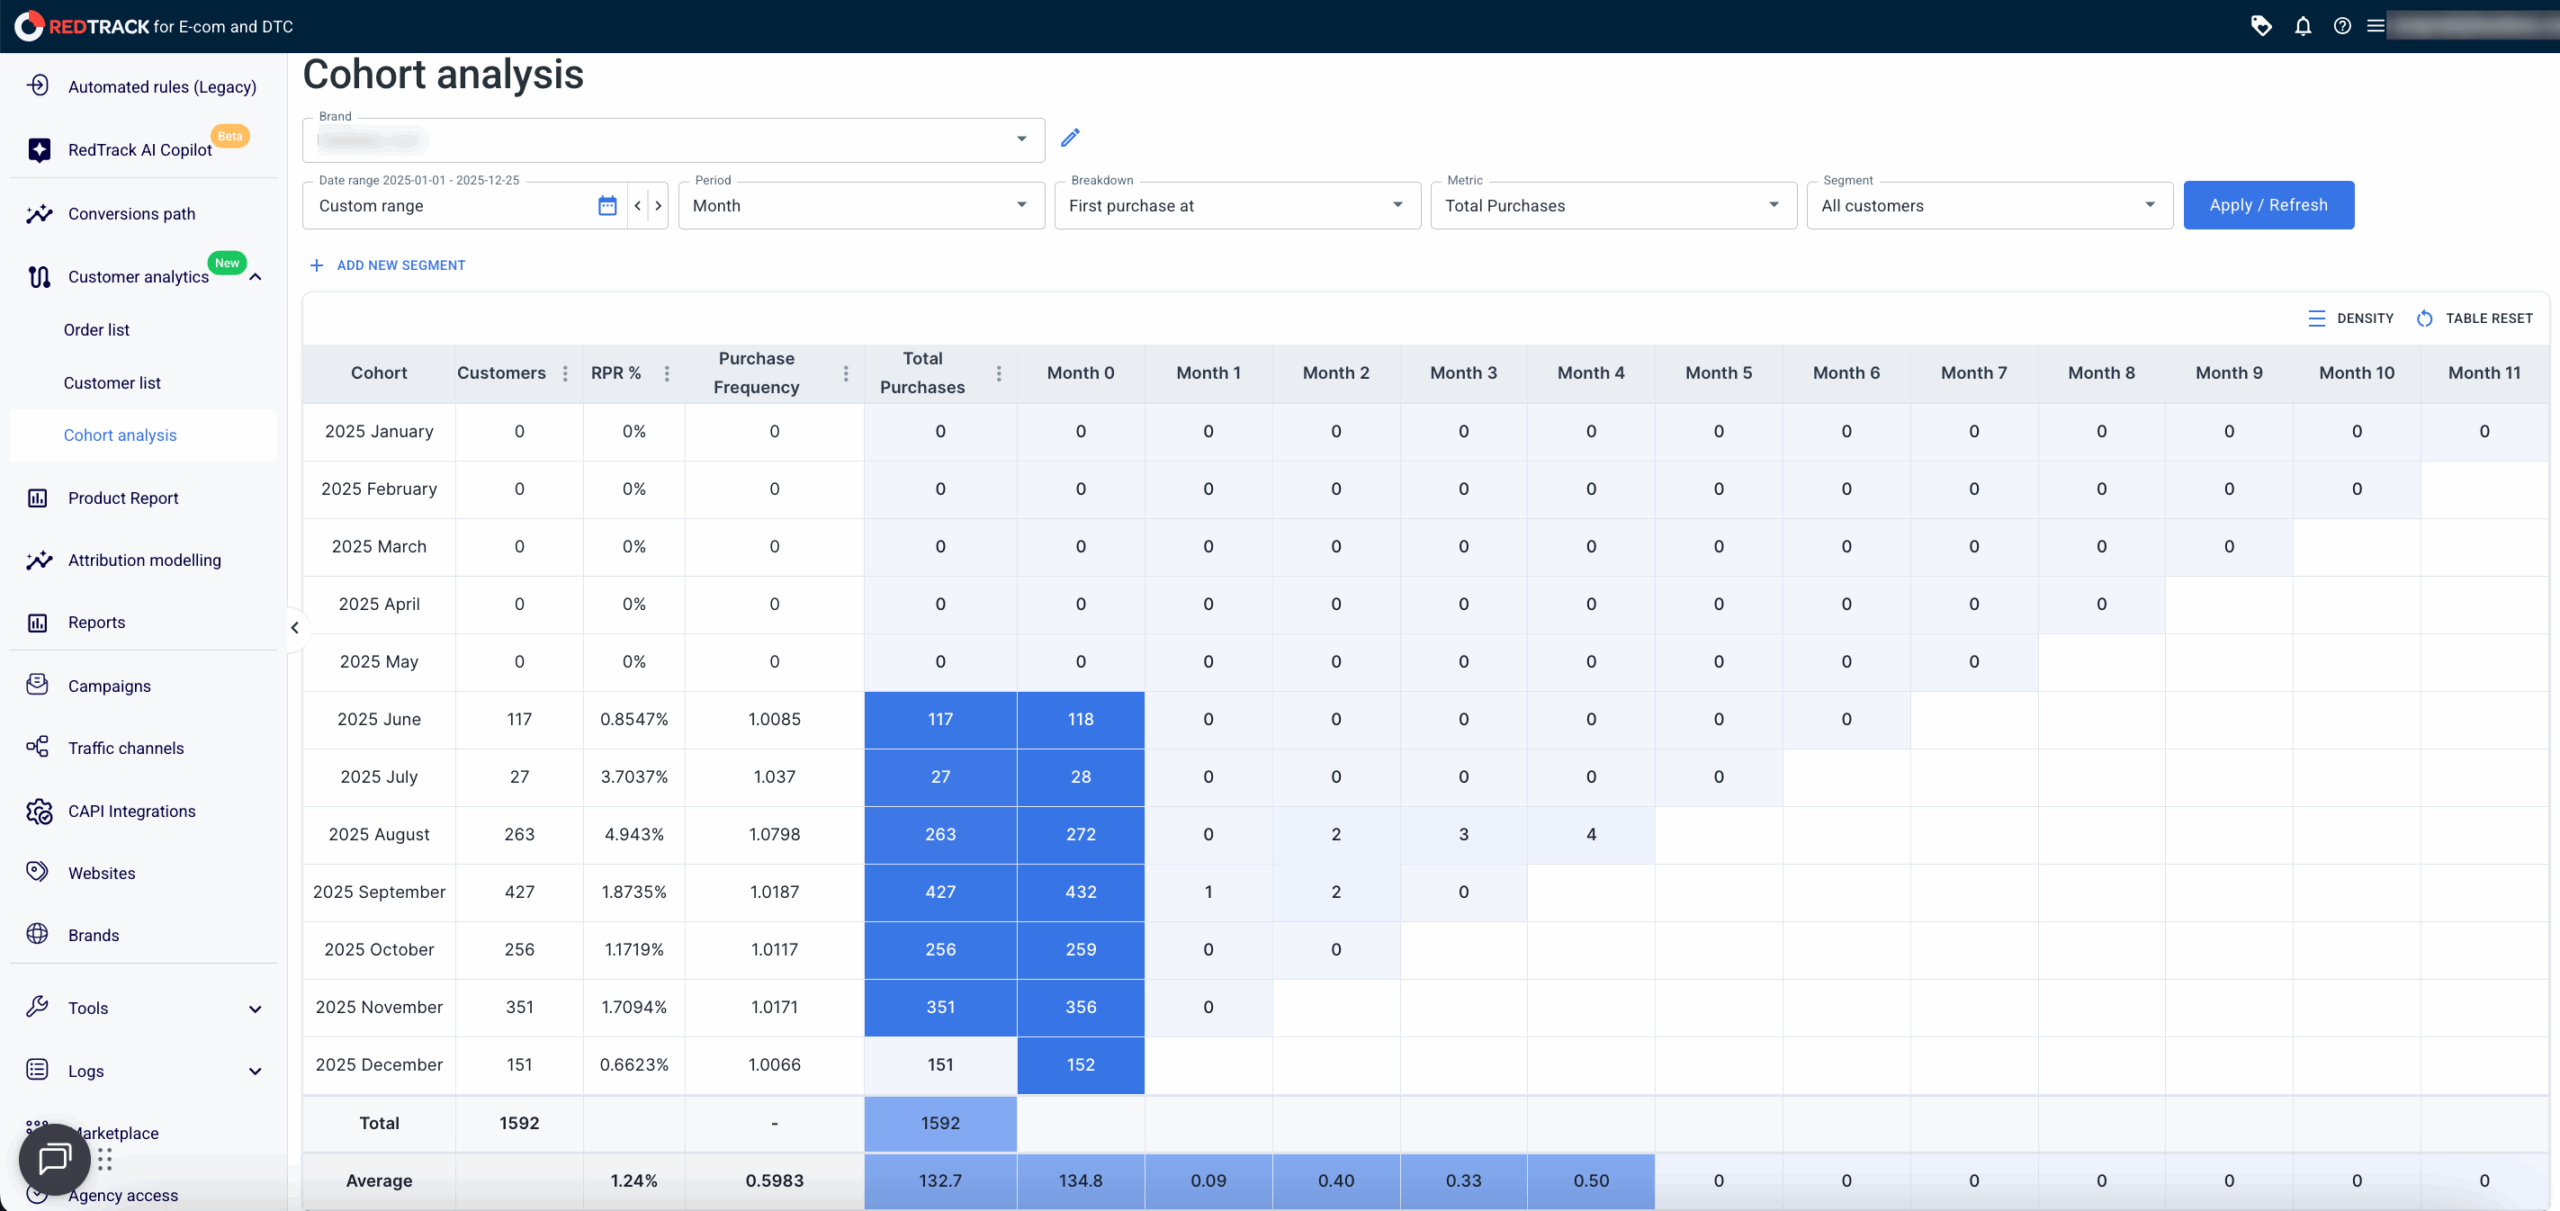
The table below explains what each metric represents and how it is calculated.
Metric | Description |
|---|---|
Customers | The number of customers within the cohort, based on the selected filters and segments. |
RPR (Repeat Purchase Rate) | The percentage of customers in the cohort who made repeat purchases during the cohort period. |
Purchase Frequency | The average number of purchases per customer in the cohort is calculated by dividing the total number of purchases by the number of customers. |
Total Purchases | The total number of purchase events made by customers in the cohort. |
Total Revenue | The total revenue generated by the cohort, including purchases, upsells, and other revenue-generating events. |
AOV (Average Order Value) | The average revenue per purchase is calculated by dividing total purchase revenue by the total number of purchases. |