Creative Analytics
Creative Analytics: report overview
Creative Analytics is a visual reporting feature that shows your creatives alongside their performance data in a single report. It combines creatives synced from connected advertising platforms with RedTrack metrics, so you can review creative previews, names, types, and key results in one place.
By bringing visuals and performance data together, Creative Analytics helps you quickly identify which creatives actually drive results. It removes the need to manually match creatives across ad platforms and tracking data, making it easier to analyse performance without relying on IDs, naming conventions, or external reports. This enables faster, more confident optimisation decisions while reducing the time spent comparing data across multiple tools.
Working with the Creative Analytics report
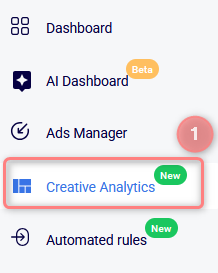
1. Go to Creative Analytics report → choose the filters → Apply:
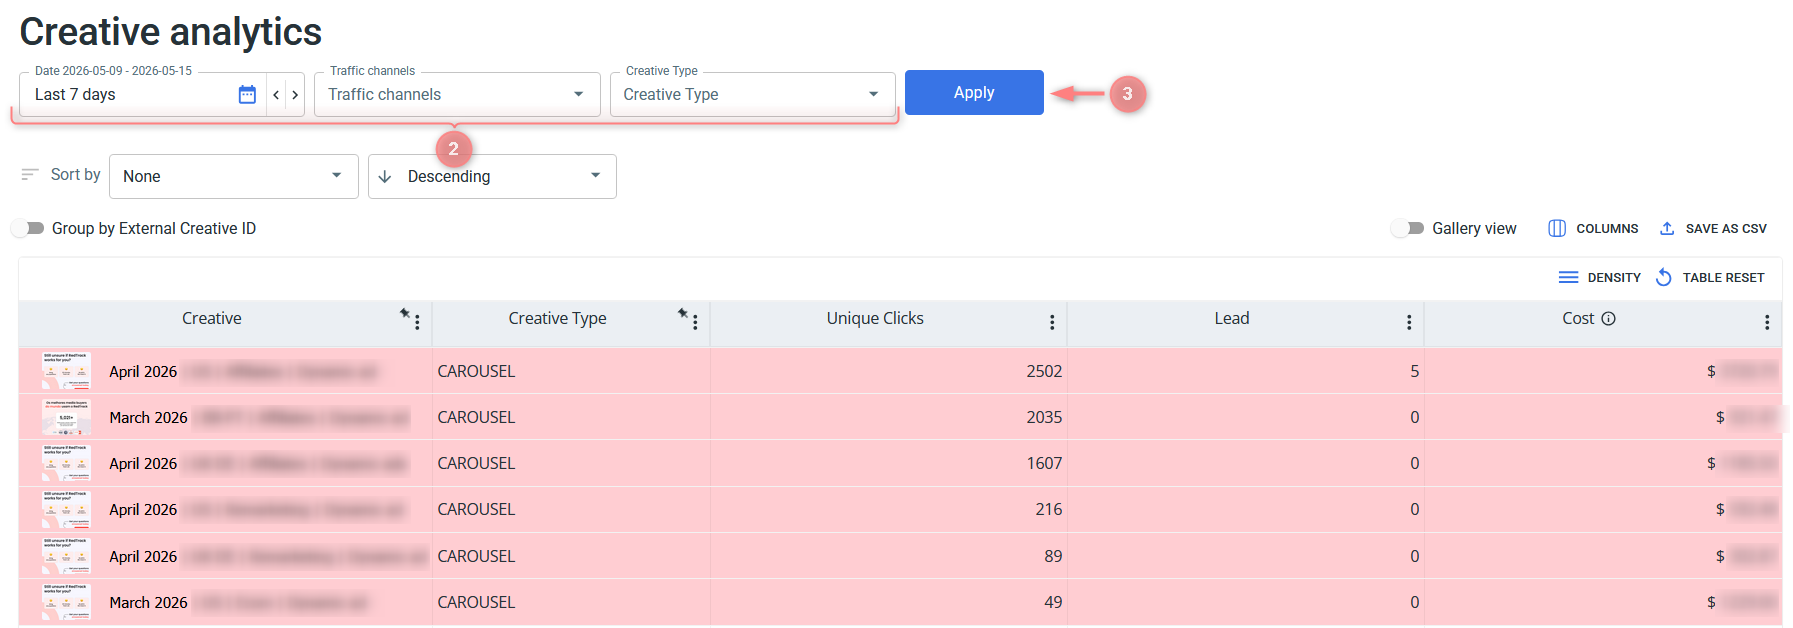
Filters explained:
Choosing a specific date lets you define the time range for the data shown (e.g., today, yesterday, custom range).
The selected date range affects performance metrics only, not the creative list. Creatives will still be displayed even if they had no activity during the selected period.
Allows you to filter creatives based on the selected traffic sources.
Allows you to filter creatives based on their format. Available options include:
- Image – static image creatives
- Video – video-based creatives
- Carousel – multi-card creatives with multiple images or videos
This filter is particularly useful when analysing performance by format, helping you identify which type of creative drives better results across your campaigns.
2. Personalize and optimize your report view:
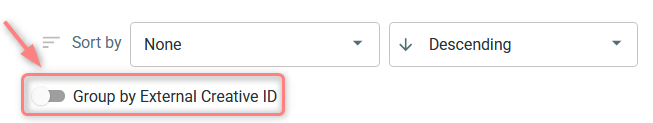
Use it to organise the table based on a selected metric (e.g. clicks, conversions). You can also choose the sorting order (ascending or descending) to quickly identify top or underperforming creatives.

The list of available sorting options is based on the columns currently visible in the table. To sort by a specific metric, make sure it is enabled in columns first.
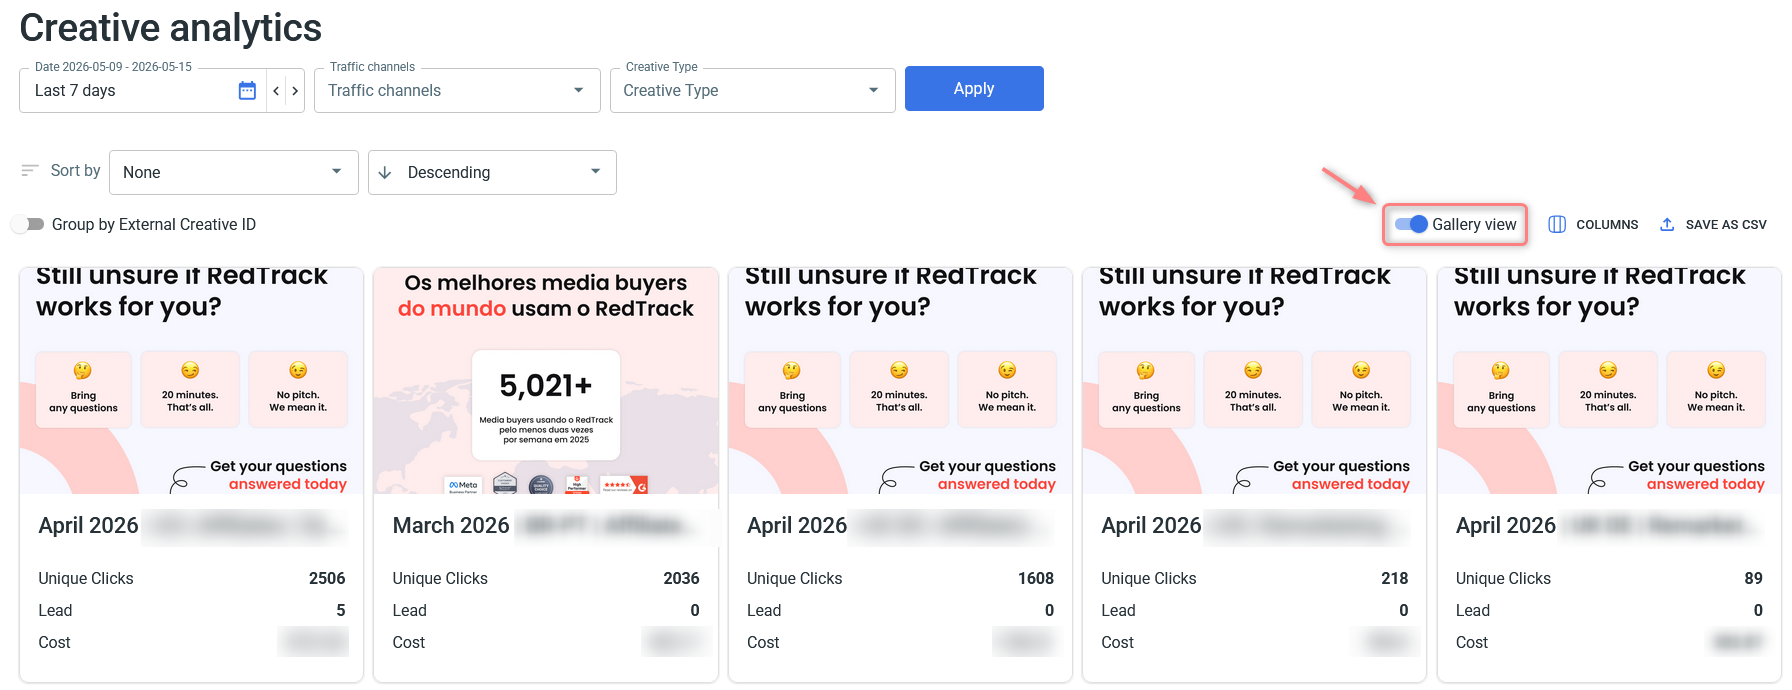
Switches the report from a table view to a visual layout, where creatives are displayed in a more image-focused format. This is useful for quickly scanning and comparing creatives visually.
You can choose which data columns to display in your report. To tailor the view to your needs, click the “Columns” button:

Use the Group by External Creative ID toggle to consolidate duplicates in your report. When enabled, creatives that share the same external creative ID are merged into a single row with combined metrics. This is especially useful when the same creative appears across multiple ad sets or campaigns, as it gives you a unified view of that creative’s total performance instead of fragmented rows.
3. The results shown in this report include all creatives that have ever been synced to your account. Creatives remain visible even if they are no longer active, have not received recent clicks, or if the integration has been disabled. This ensures that historical data is preserved, allowing for consistent reporting and long-term performance analysis.
‣ Only creatives associated with ads that generated clicks in RedTrack are included.
‣ Some creative formats may not be displayed due to platform API limitations (e.g. missing image data).
‣ Large creative libraries (over 1,000 creatives) may impact UI performance.
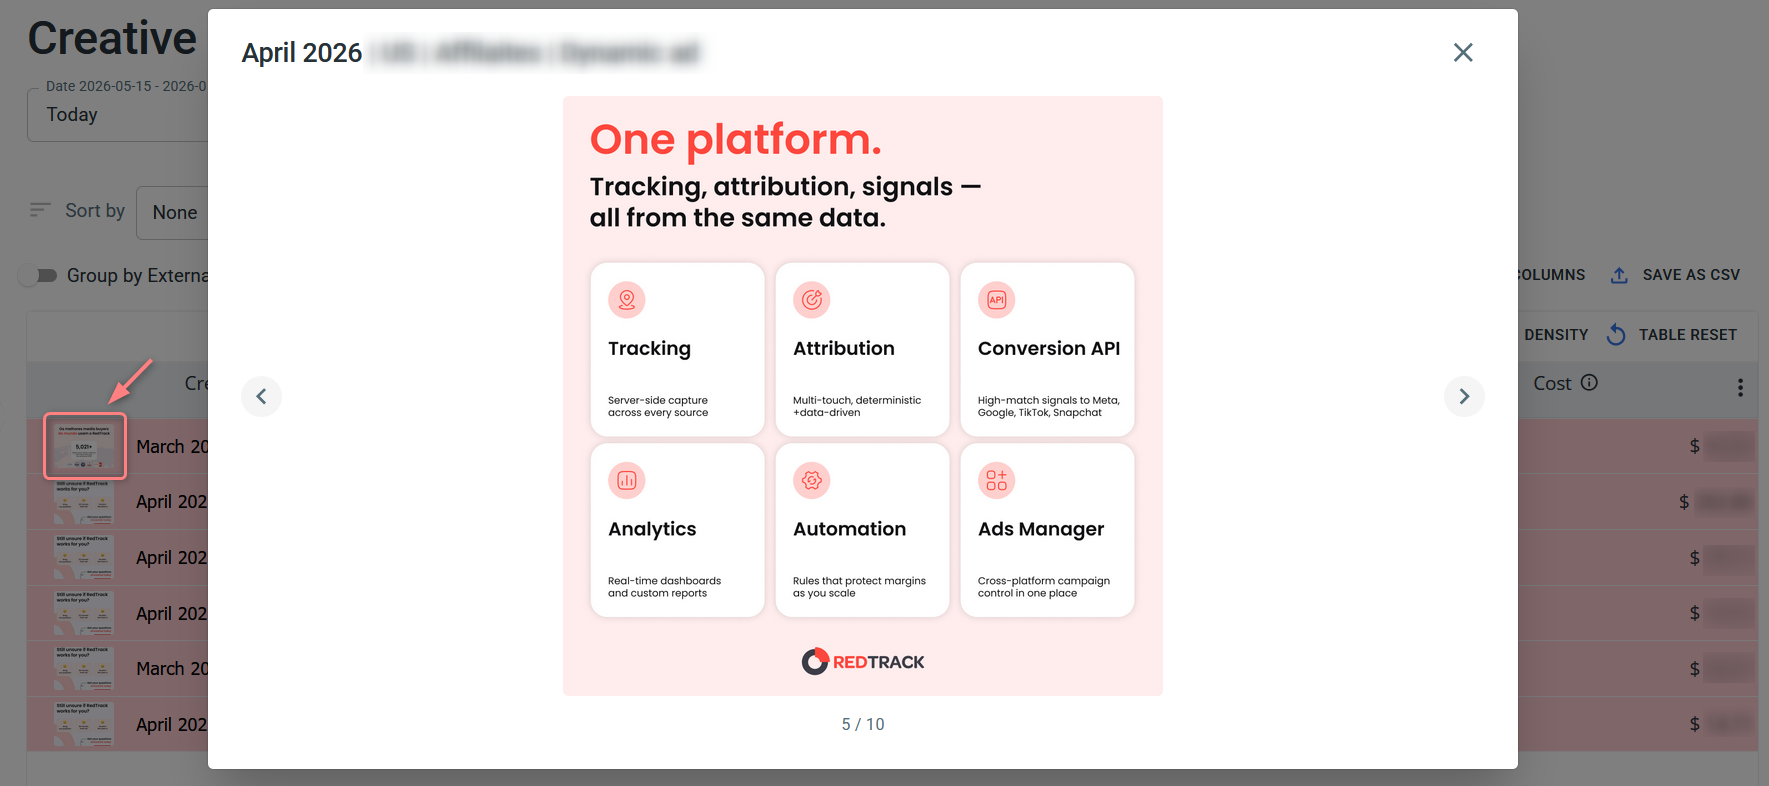
4. You can click on any creative in the table to open a preview of the images or videos. This view displays the creative asset in a larger format, allowing you to review it more clearly.