
AI Dashboard
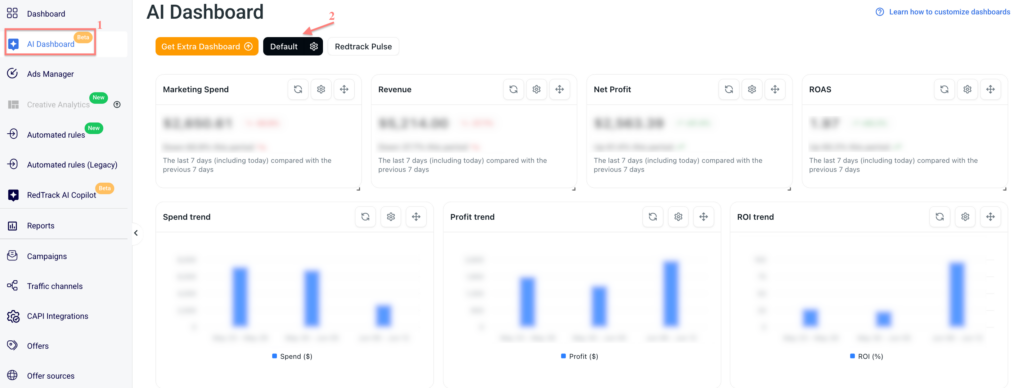
AI Dashboard helps you collect, organize, and monitor the reports you need in one place. You can use AI Dashboard to visualize your data with charts, diagrams, metric cards, and tables, so you can track performance without rebuilding reports every time.
AI Dashboard can be used to:
- monitor key performance metrics,
- compare results across periods,
- save reports generated by RedTrack AI Copilot,
- organize reports by campaign, offer, traffic source, or business goal,
- take actions directly from AI-generated widgets.
Each account receives a Default AI Dashboard based on the account type. It is preconfigured with the most relevant metrics for that business model:
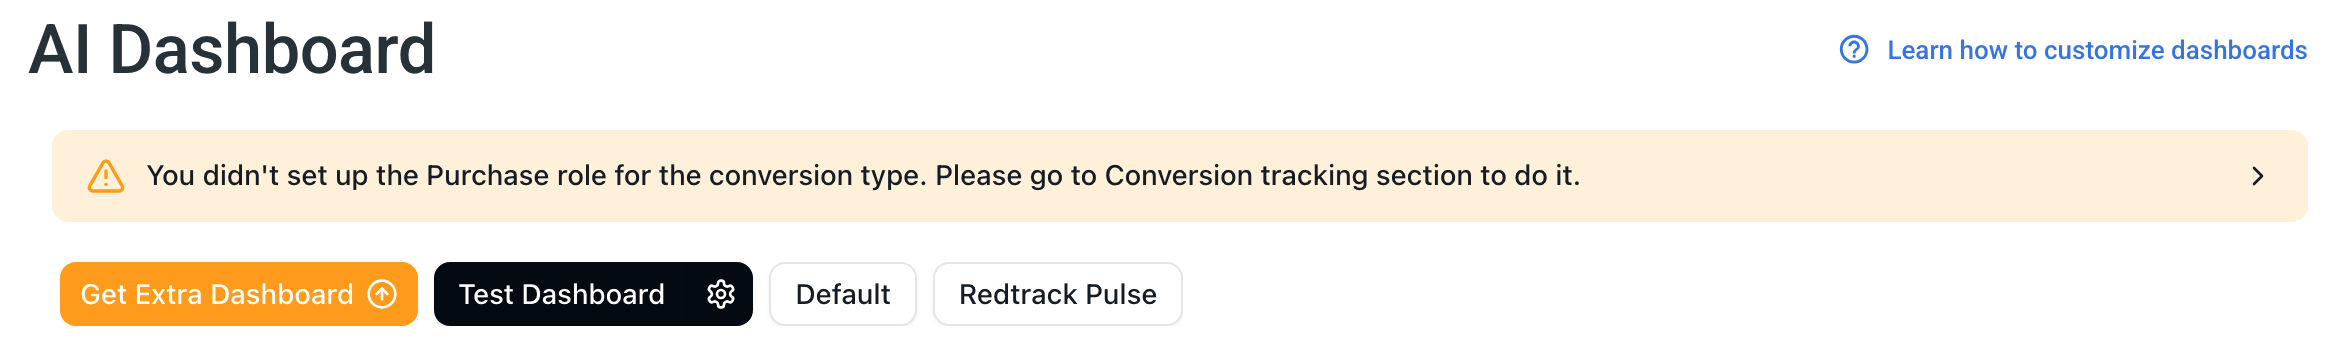
To learn more about the conversion tracking roles, follow this guide.
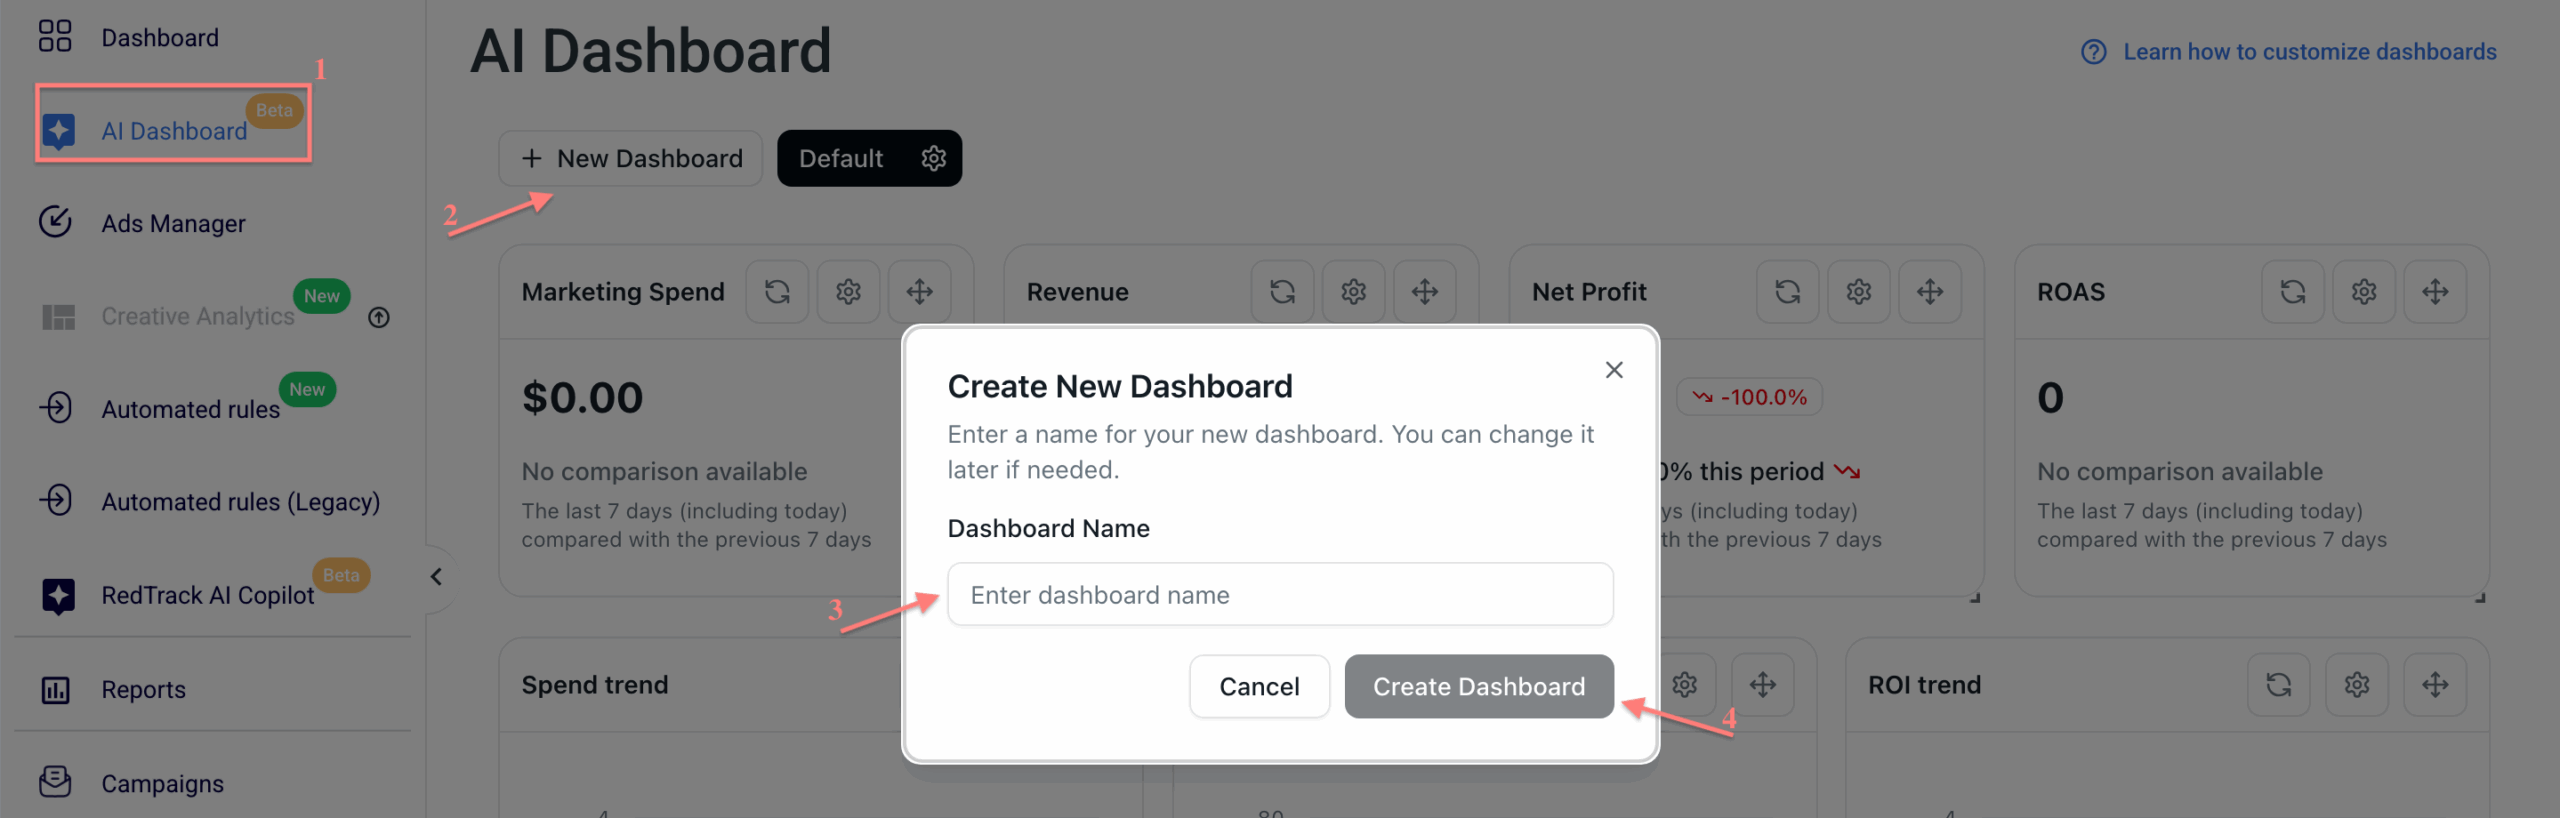
Working with AI Dashboard
Go to AI Dashboard → New Dashboard → enter a dashboard name → Create Dashboard:
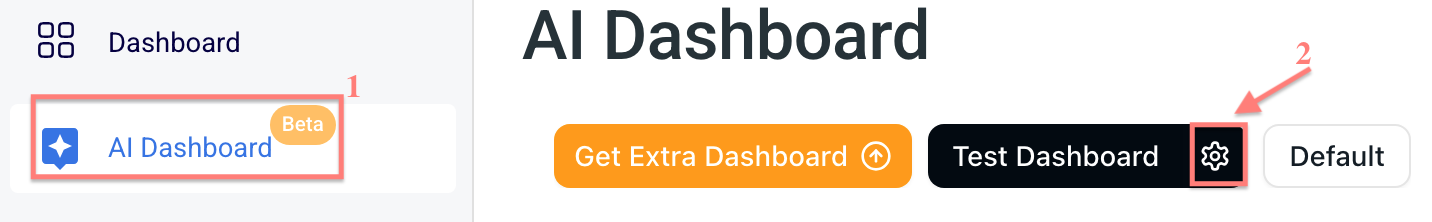
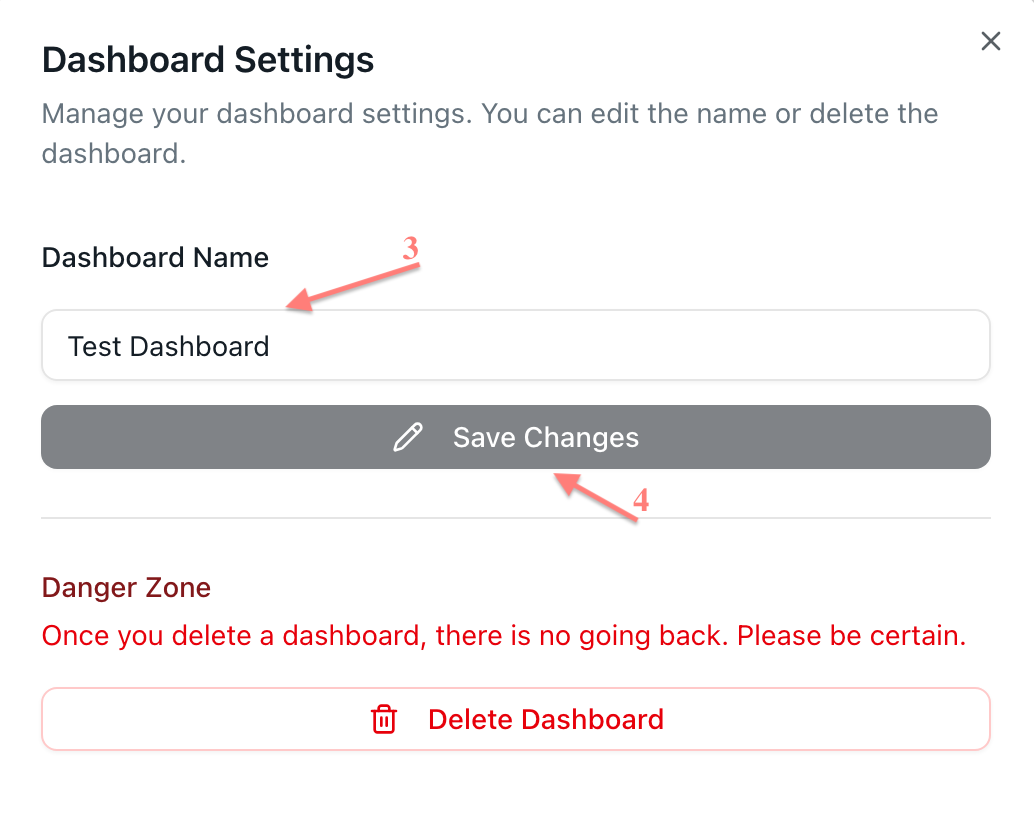
Open the dashboard you want to rename → click the settings icon next to the dashboard name → edit the name → Save Changes:
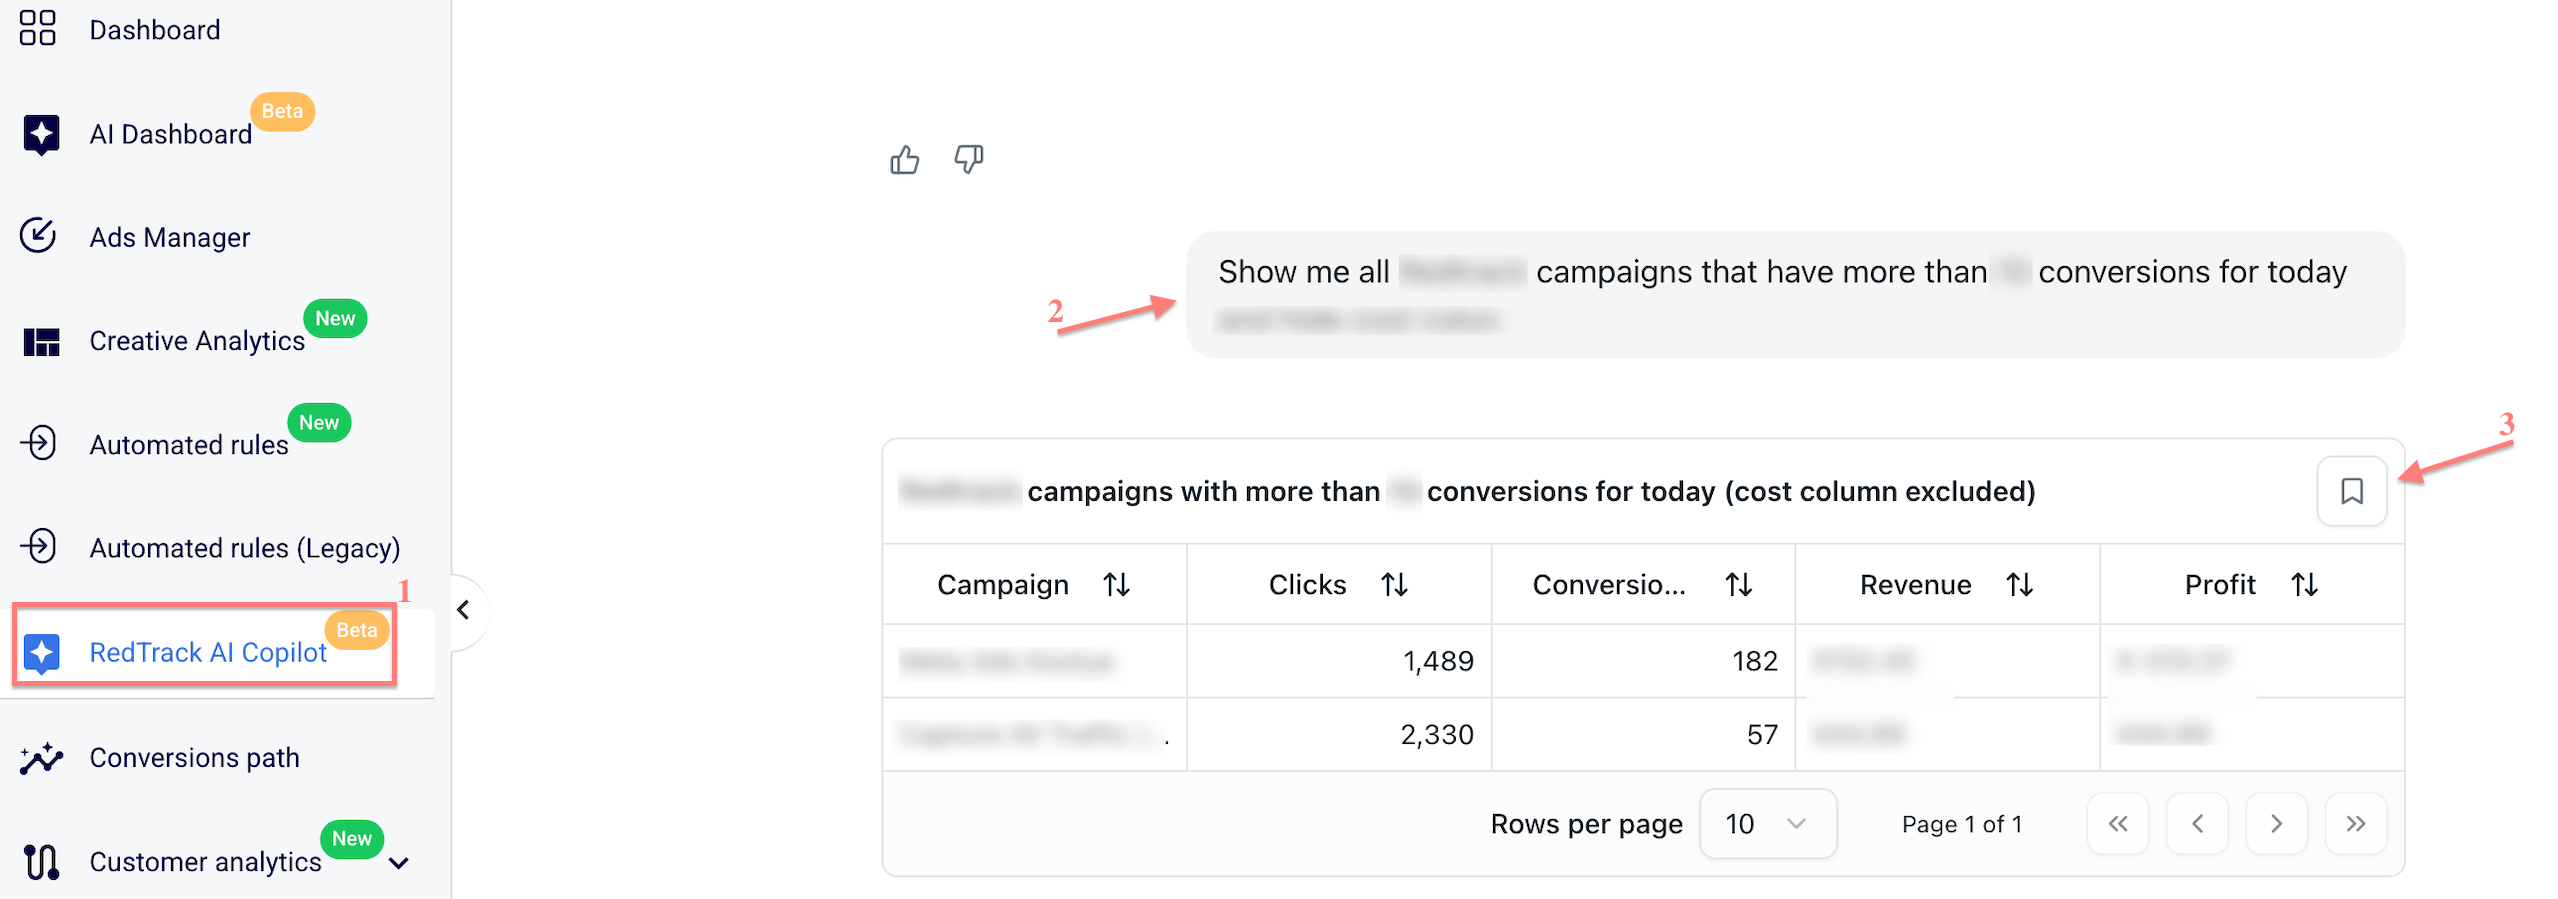
You can save reports generated by RedTrack AI Copilot and add them to your dashboards for further analysis.
1. Go to RedTrack AI Copilot → enter a question about your stats → click the bookmark icon in the top-right corner of the report:
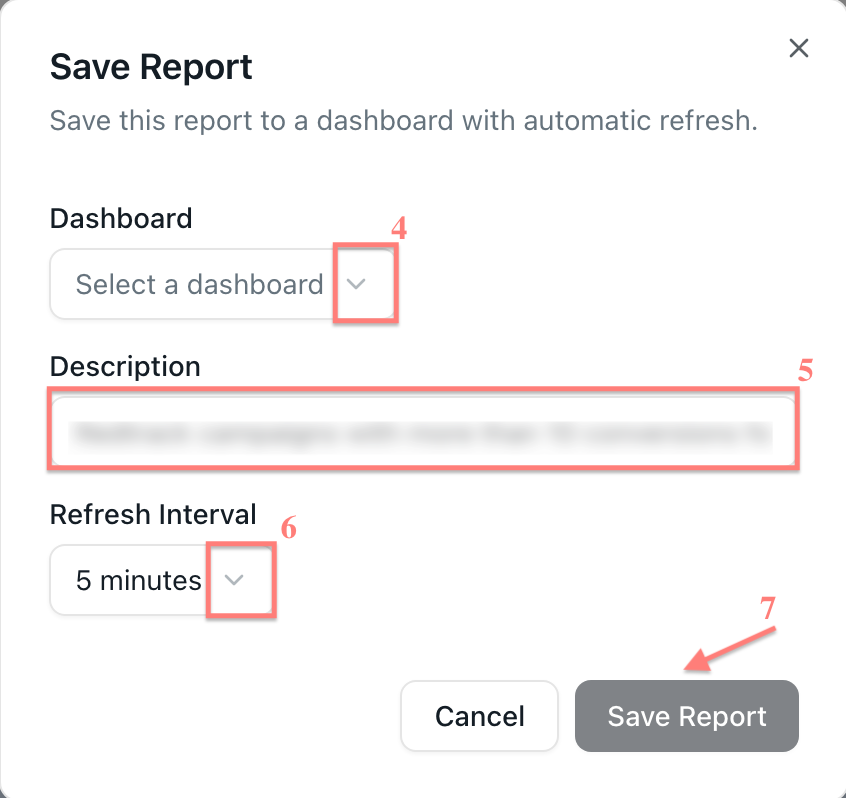
2. Select a dashboard → enter the report name (auto-filled, you can change it)→ choose the refresh interval → Save Report:
You can change the report name, the refresh interval, or remove the report from the report menu.
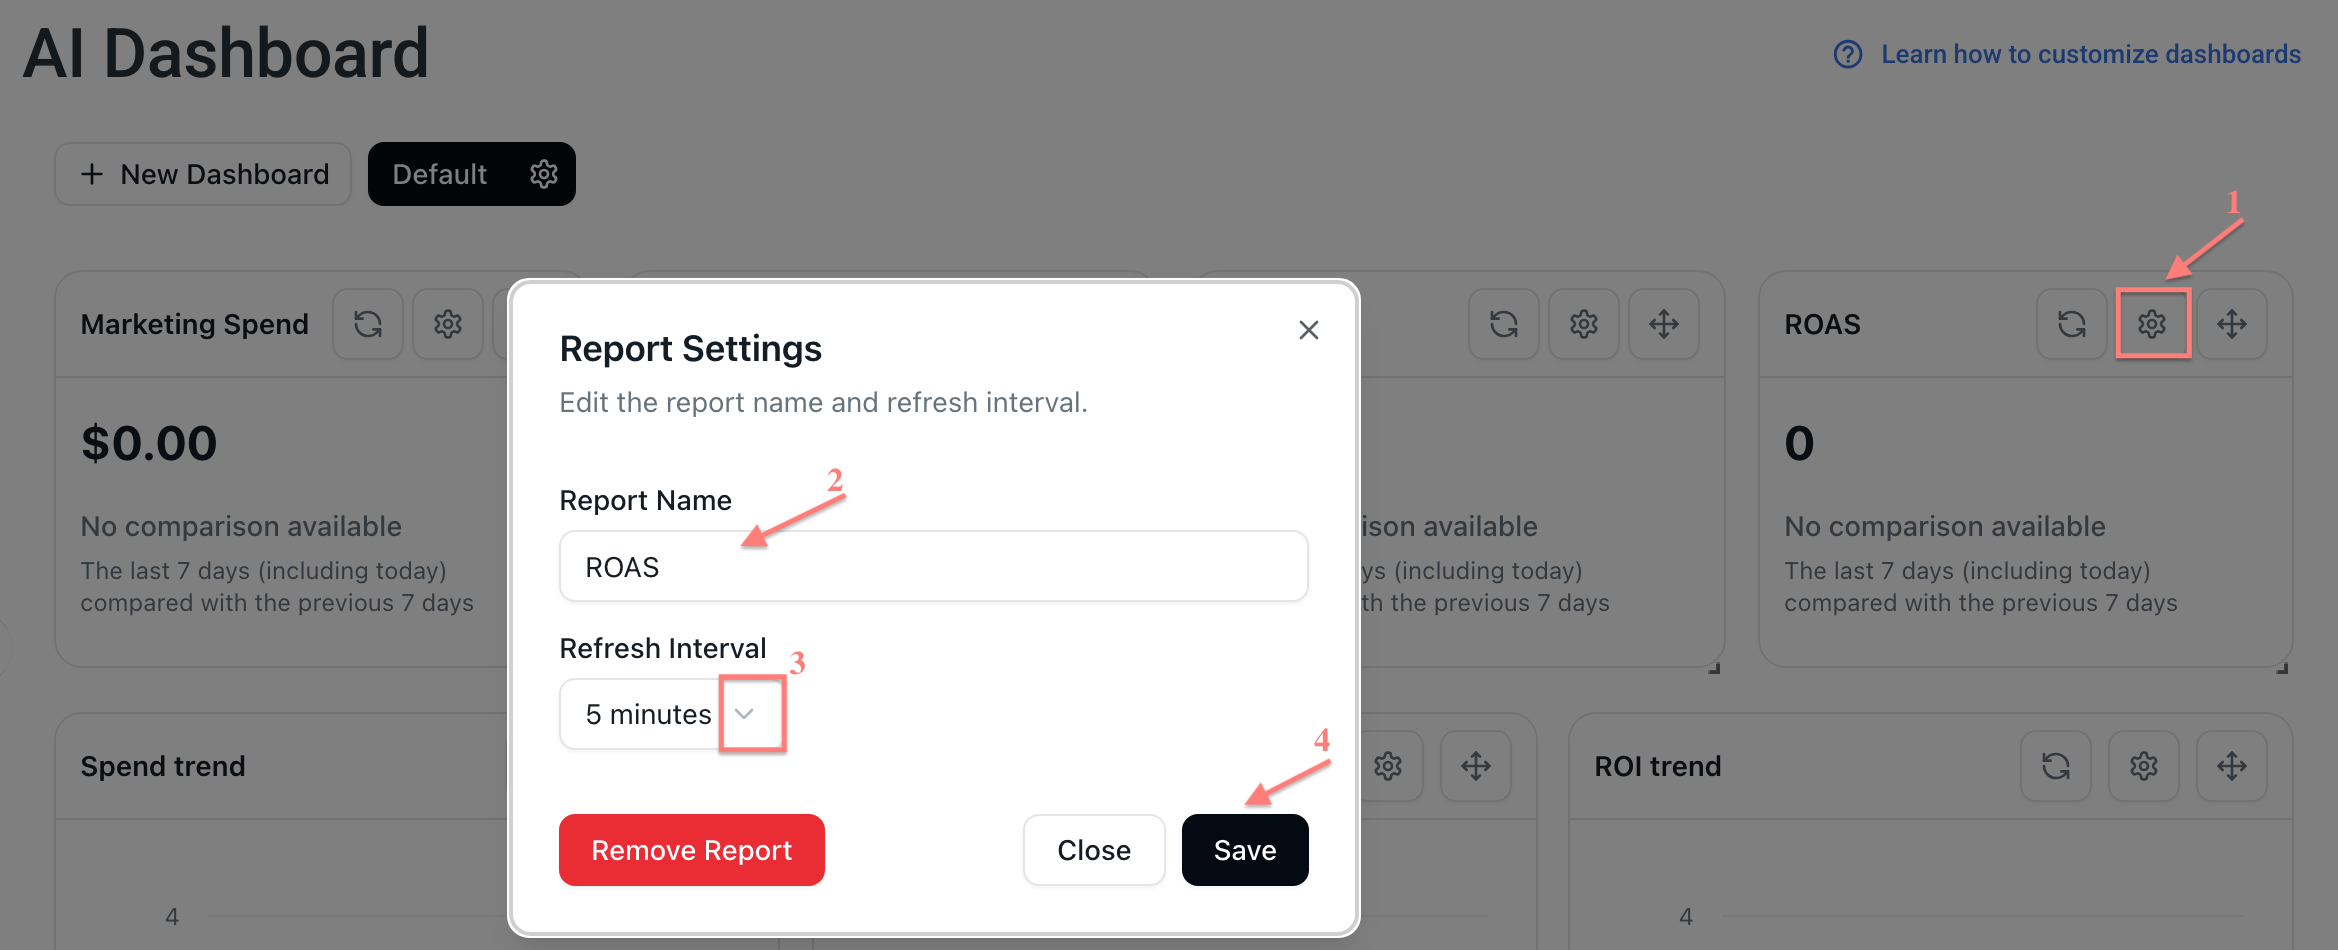
To edit report settings, choose the report → click the settings icon → change the name or auto-refresh interval → click Save:
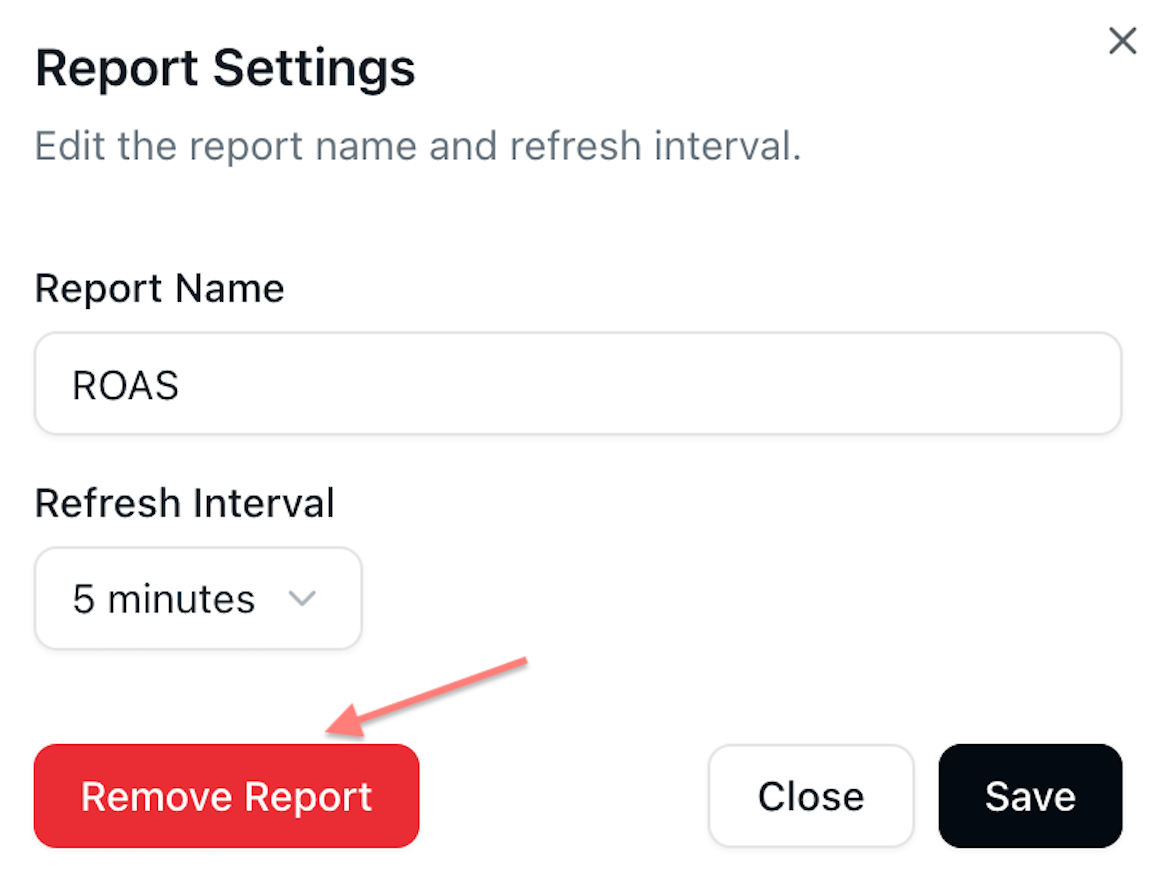
To delete the report, choose the report → click the settings icon → Remove Report:
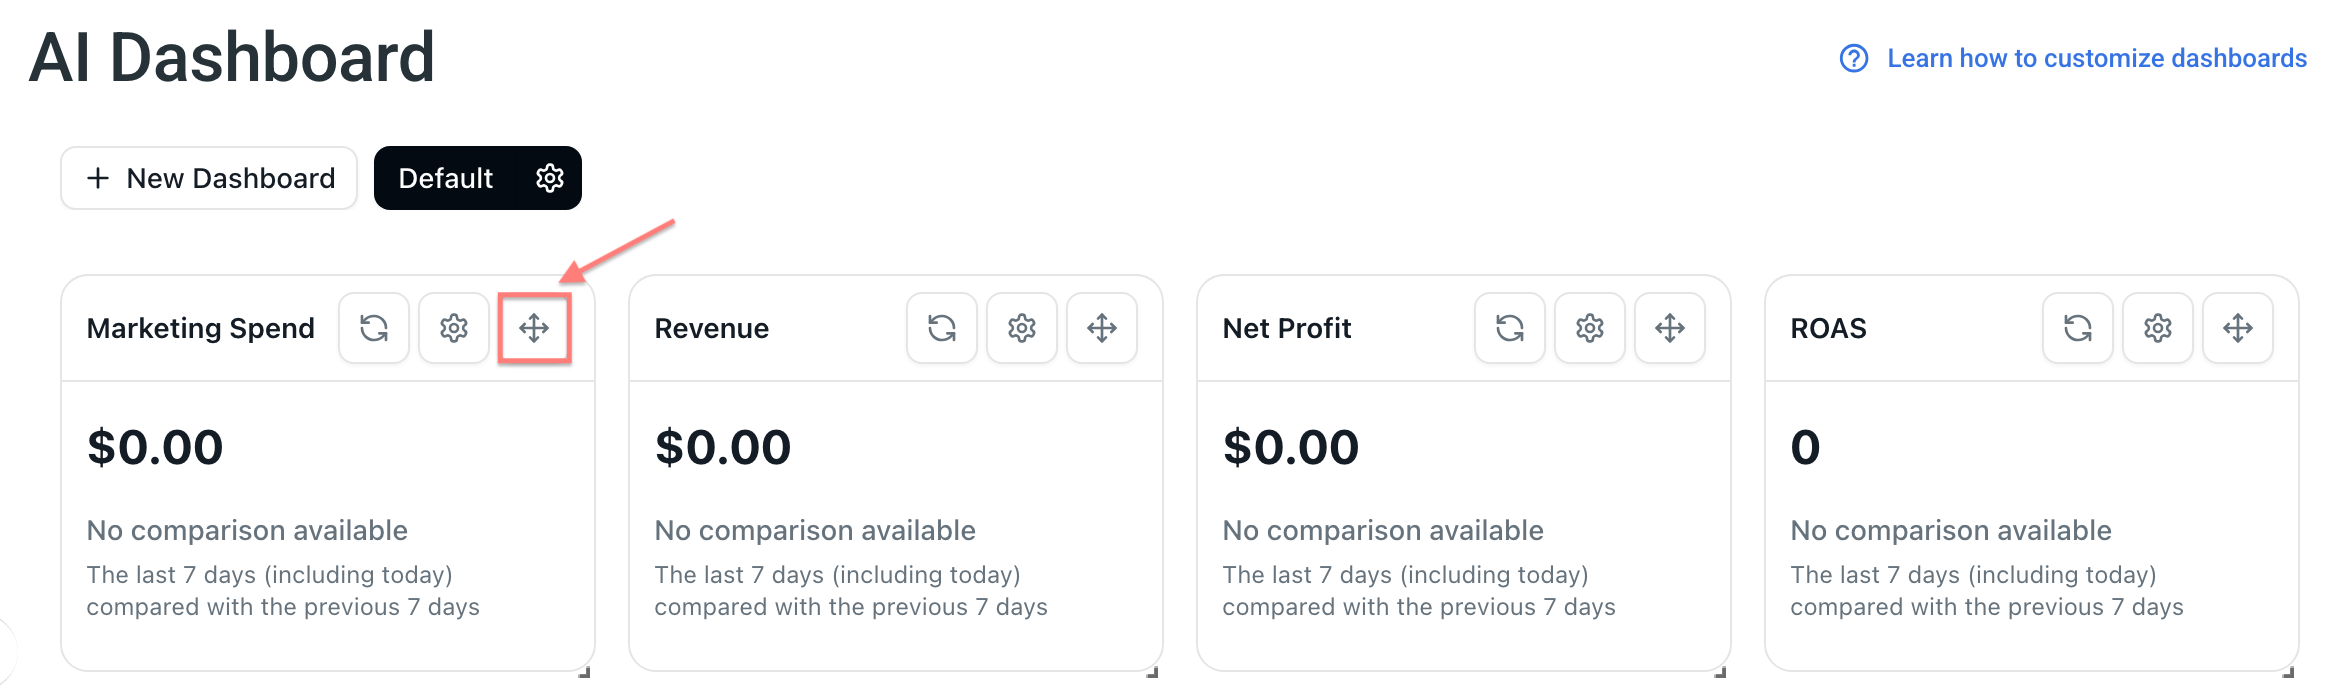
To move a report, hold the move icon and drag it to a new position:
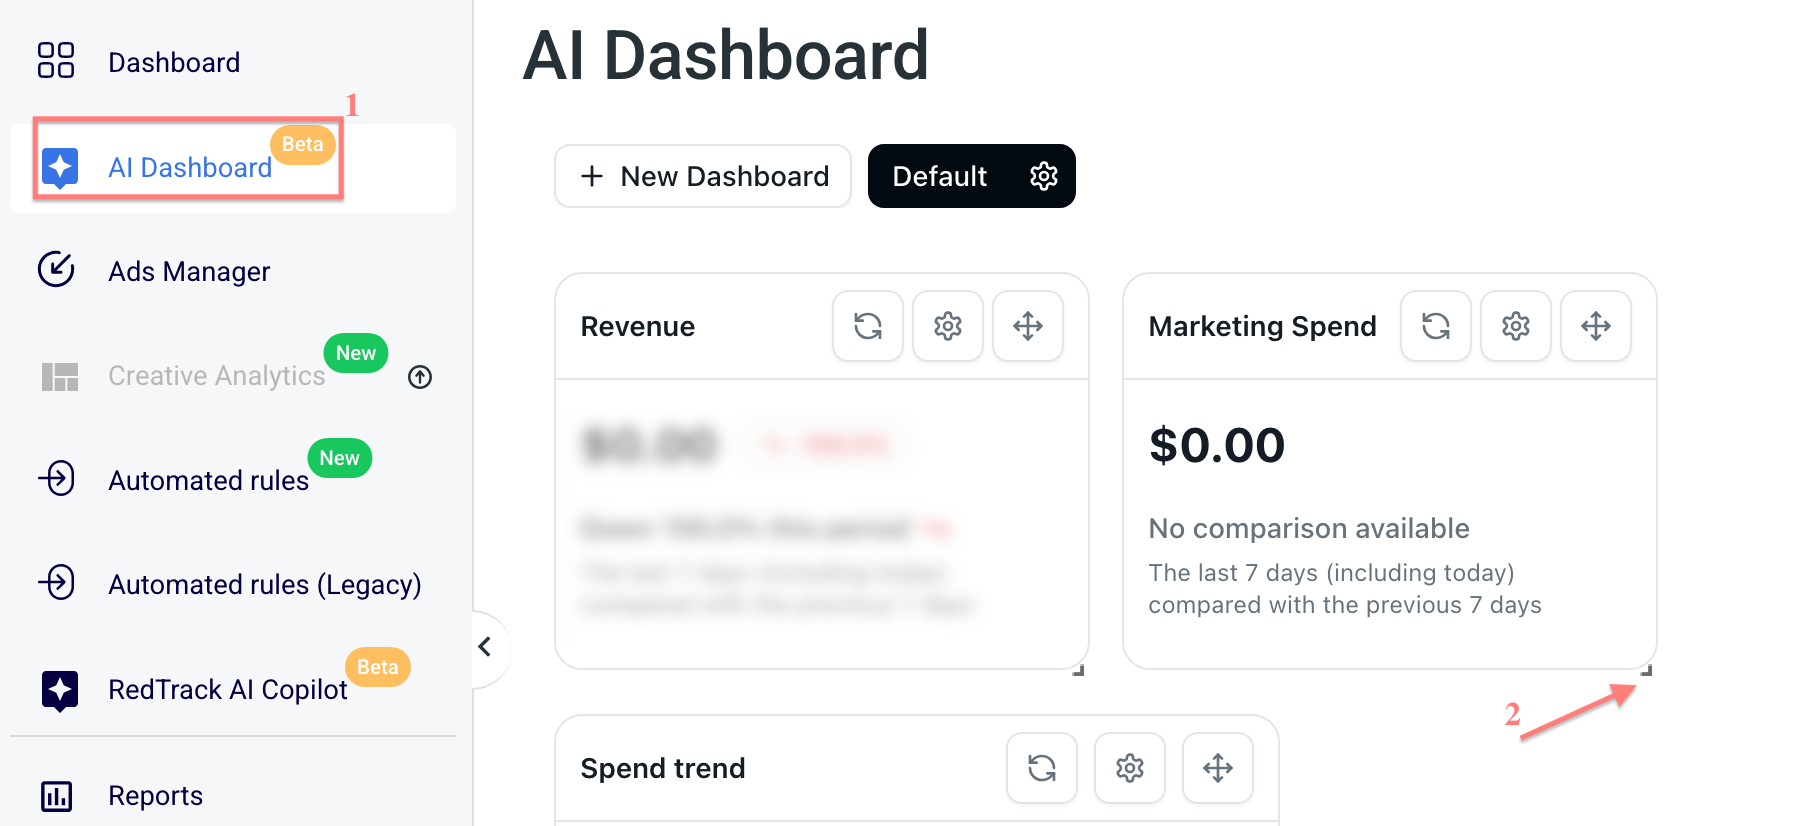
To resize a report, drag the bottom-right corner of the report:
RedTrack Pulse
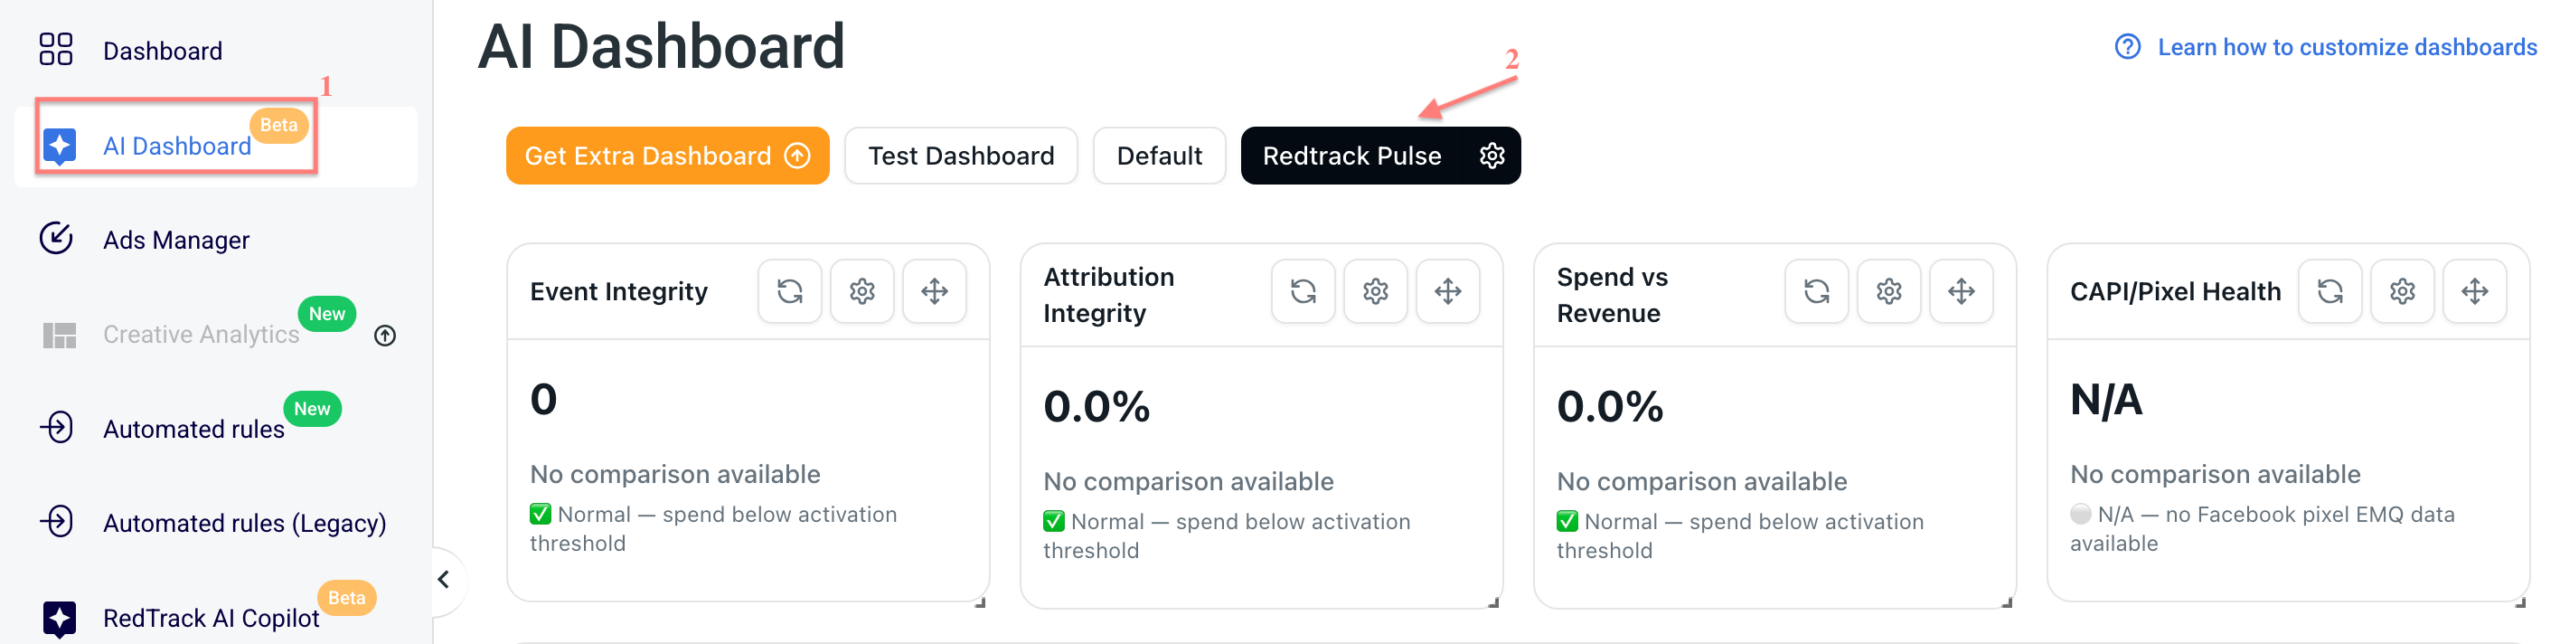
RedTrack Pulse is a built-in tracking health monitor available inside AI Dashboard. It helps you quickly understand whether your tracking data looks healthy or if something may require attention.
Pulse compares the current 7 days with the previous 7 days and checks key tracking signals, such as conversions, attribution, revenue, and CAPI / Pixel health.
To open it, go to AI Dashboard → click RedTrack Pulse:
Status levels
Each signal in RedTrack Pulse has one of the following statuses:
| Status | Meaning |
|---|---|
| ✅ Normal | No anomaly detected |
| 🟡 Warning | Something may require attention |
| 🔴 Critical | A serious issue may require action |
| ⚪ N/A | There is not enough data to assess the signal |

RedTrack Pulse activates when spend reaches the minimum required level: $20 or 10% of the account’s average daily spend, whichever is higher.
Tracking signals
RedTrack Pulse checks 4 main tracking health signals.
Event Integrity helps detect whether conversions dropped while spend stayed stable. This may indicate that conversion tracking is not working correctly.
Common causes:
- broken pixel,
- stopped or incorrect postback,
- CAPI integration issue,
- offer issue.
| Level | Condition |
|---|---|
| 🔴 Critical | Conversions decreased by more than 50% week over week, and spend decreased by less than 15% |
| 🟡 Warning | Conversions decreased by more than 30% week over week, and spend decreased by less than 15% |
| ✅ Normal | Conversion drop is proportional to spend |
Attribution Integrity helps detect whether the share of unattributed conversions increased compared with the account’s usual baseline. This may indicate that conversions are coming in, but RedTrack cannot properly attribute them to campaigns or traffic sources.
Common causes:
- broken UTM tags,
- attribution window changes,
- new traffic source without proper tagging.
| Level | Condition |
|---|---|
| 🔴 Critical | Unattributed share is more than 20 percentage points above baseline, or more than 50% absolute |
| 🟡 Warning | Unattributed share is more than 10 percentage points above the 7-day baseline |
| ✅ Normal | Drift is less than 10 percentage points from baseline |
Spend vs Revenue helps detect whether campaigns are spending money while revenue is missing or unexpectedly low. This may indicate that revenue tracking or payout data is not being passed correctly.
Common causes:
- revenue postback issue,
- missing payout on conversions,
- affiliate network model change,
- offer issue.
| Level | Condition |
|---|---|
| 🔴 Critical | Revenue is $0 while there is active spend, or revenue decreased by more than 60% while spend is stable |
| 🟡 Warning | ROI decreased by more than 40% from the 7-day average while spend is stable |
| ✅ Normal | ROI changes proportionally to spend |
CAPI / Pixel Health checks Meta Event Match Quality. This shows how well Meta can match CAPI events to real users. A low match rate can affect ad delivery and targeting quality, even if conversions and revenue still look correct in RedTrack.
Common causes:
- missing quality parameters, such as email, phone, fbp, or fbc,
- events are not deduplicated with pixel,
- pixel matching settings are incorrect.
| Level | Condition |
|---|---|
| 🔴 Critical | Match Rate is below 60%, or decreased by more than 25 percentage points week over week |
| 🟡 Warning | Match Rate is between 60% and 75%, or decreased by more than 15 percentage points week over week |
| ✅ Normal | Match Rate is above 75% |