RedTrack AI Copilot
RedTrack AI Copilot is an AI-powered assistant. It helps you work with your data faster by turning questions into insights, reports, charts, tables, and metric cards.
Use AI Copilot to analyze performance, explore trends, generate visual reports, find relevant RedTrack help articles, and perform supported campaign actions directly from chat.
With RedTrack AI Copilot, you can:
- ask questions about your performance data
- generate charts, tables, and metric cards
- compare results and identify trends
- find relevant RedTrack guides
- update supported campaign settings from chat
- save generated reports to AI Dashboards
How to use RedTrack AI Copilot
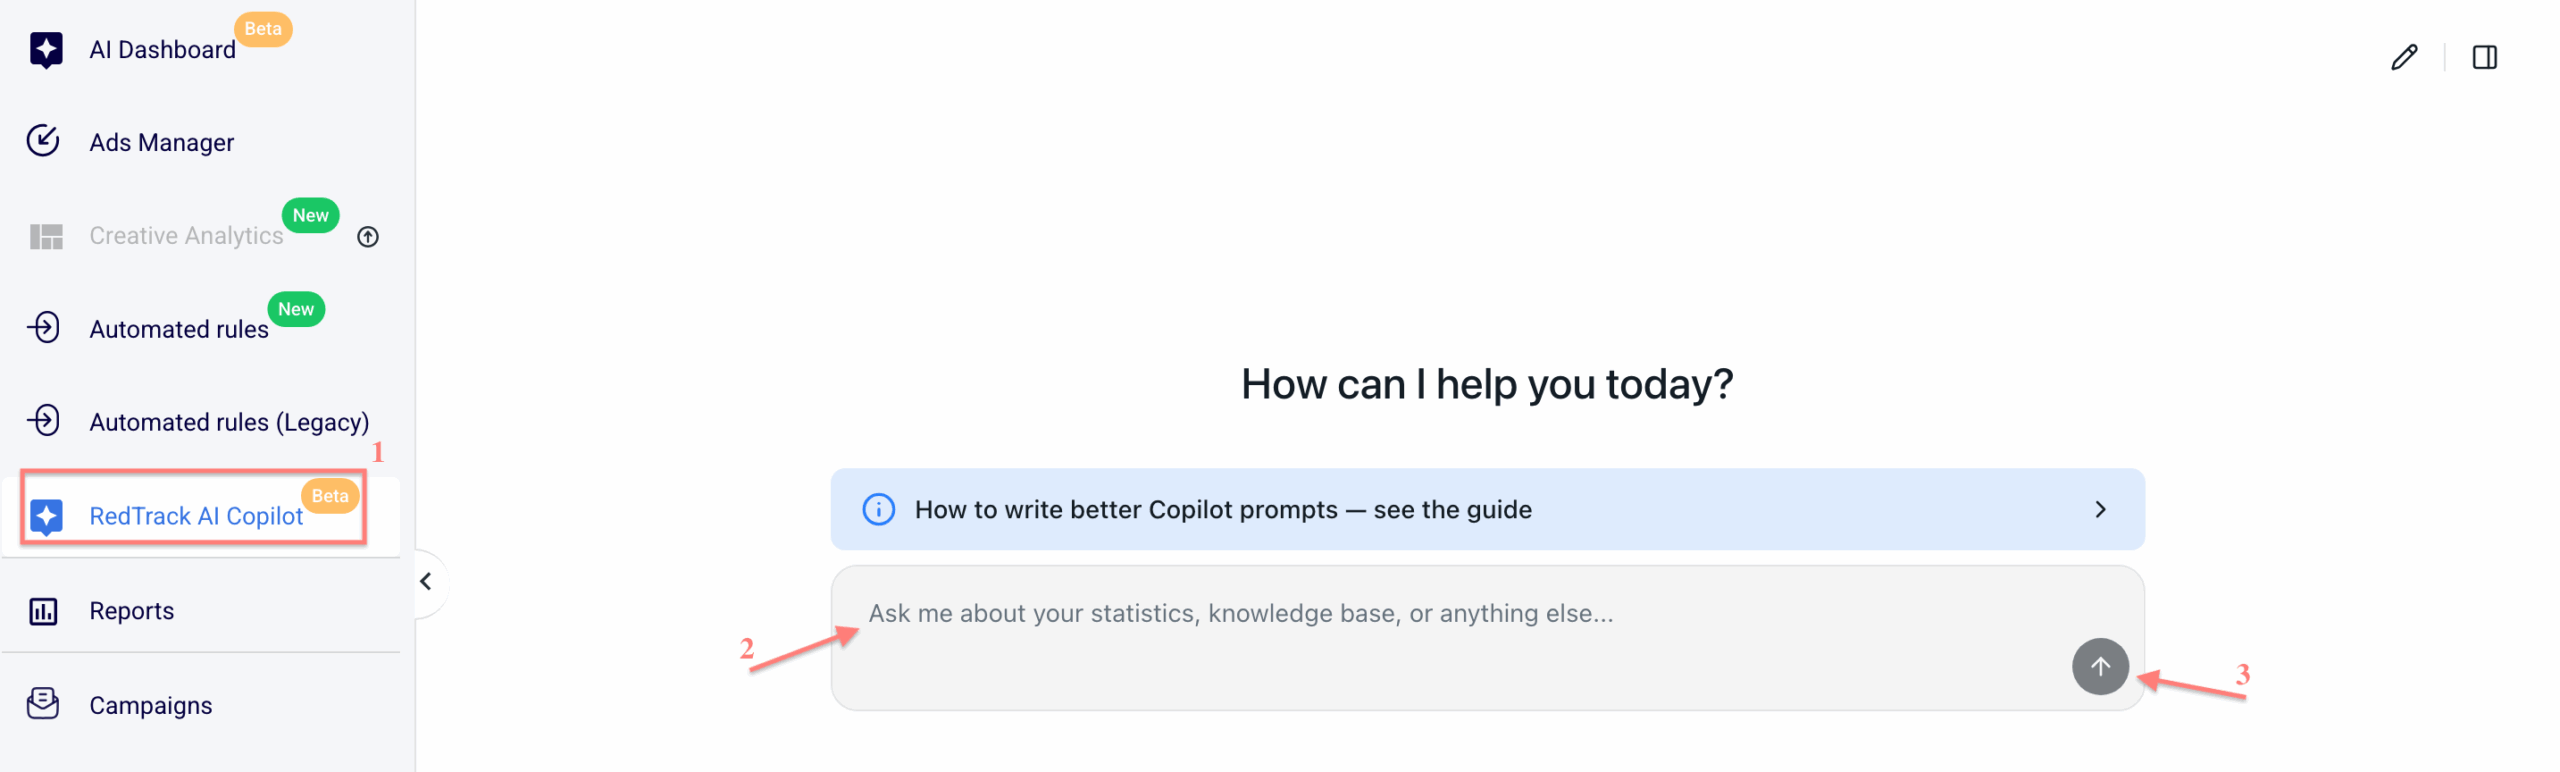
1. Go to RedTrack AI Copilot → type your request into the input field → click the submit button:
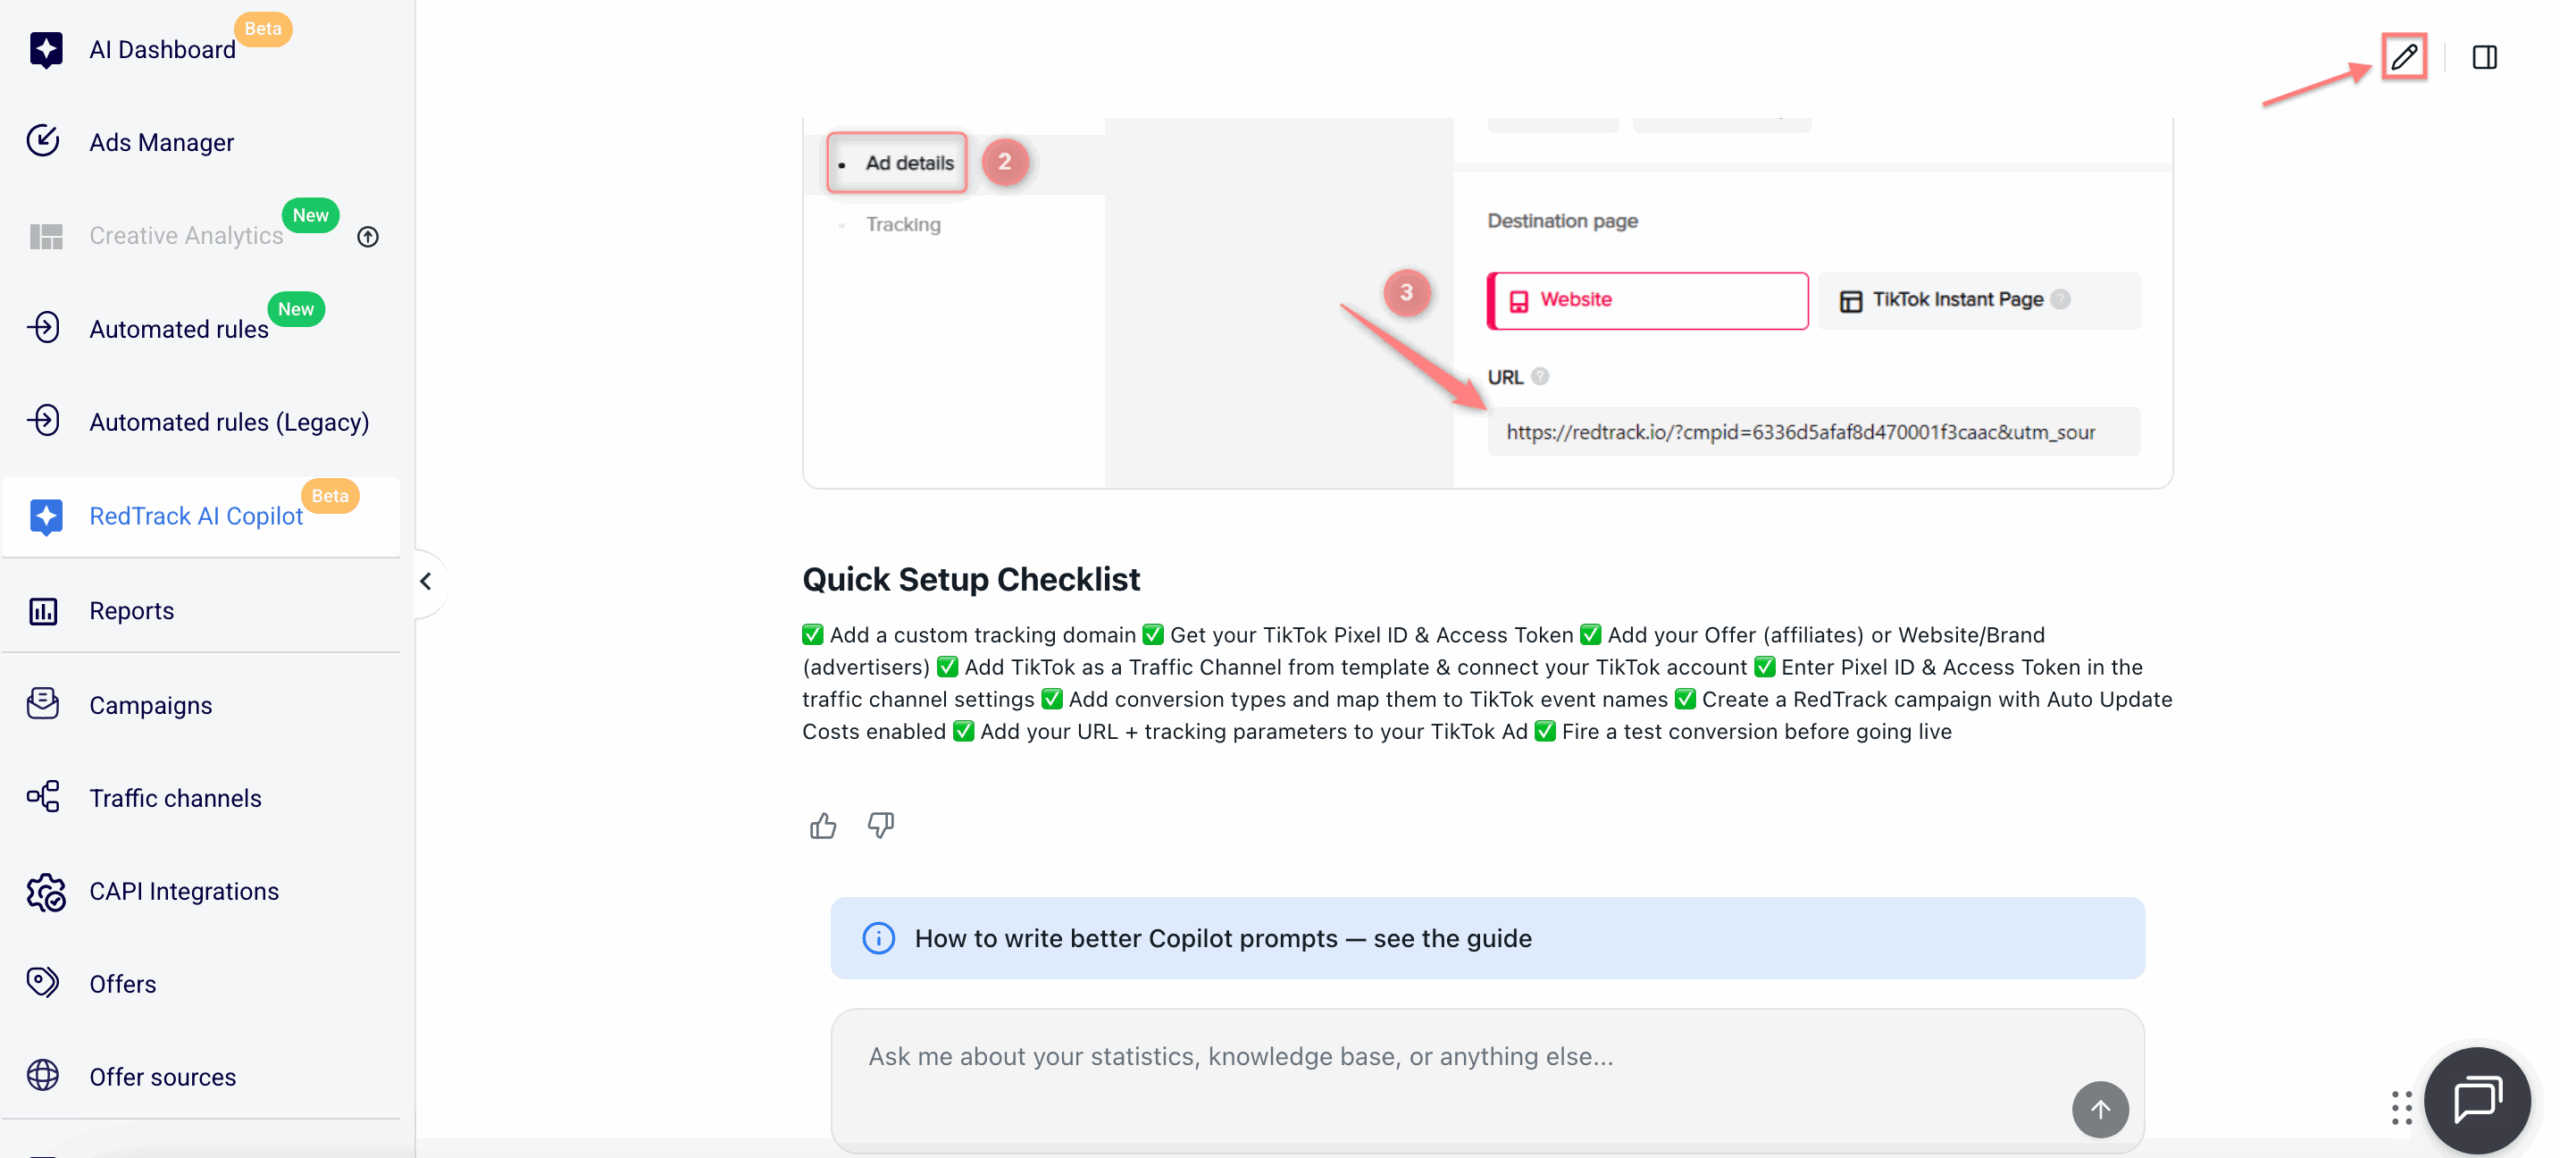
2. Once a response is generated, you can continue the conversation by asking follow-up questions in the same chat, or start a new chat for a separate topic by clicking the pencil icon in the top-right corner:
What RedTrack AI Copilot can help with
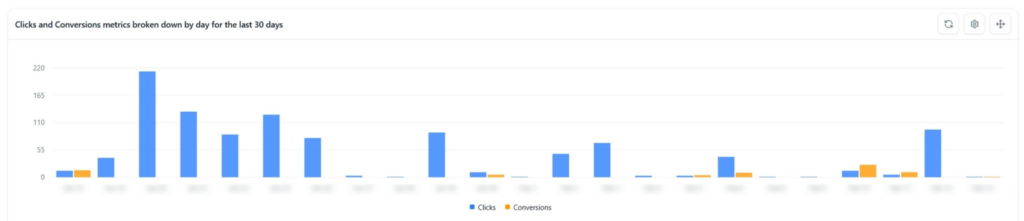
Copilot can generate visual reports based on your questions, including:
Charts
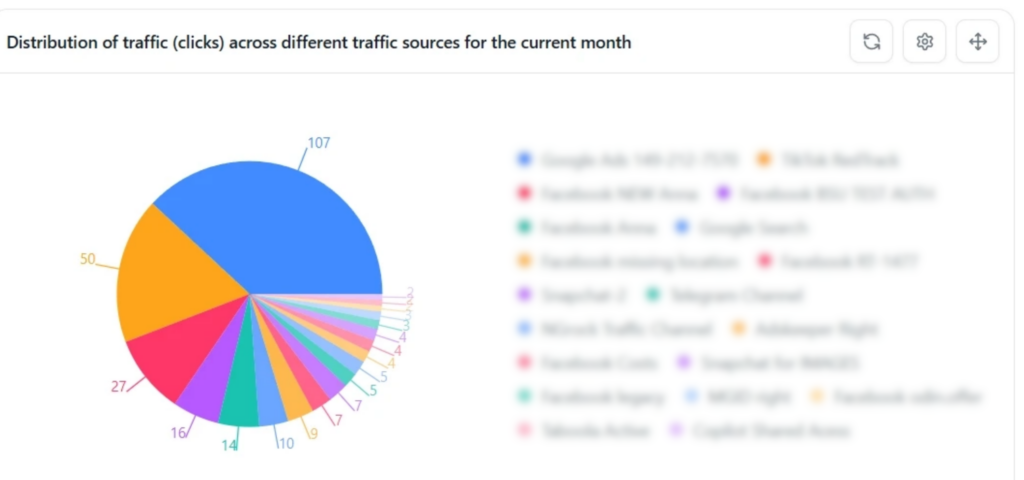
Pie charts
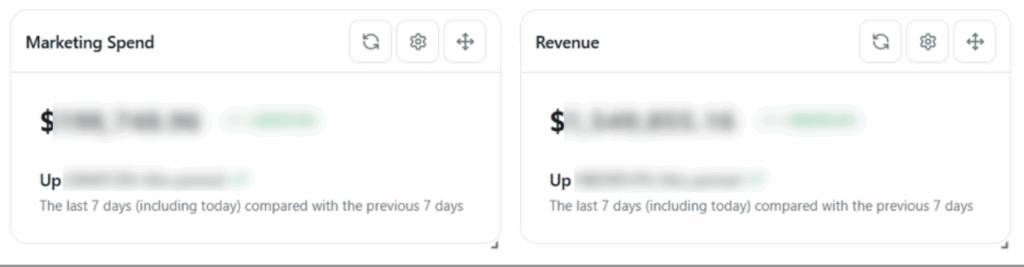
Metric Cards
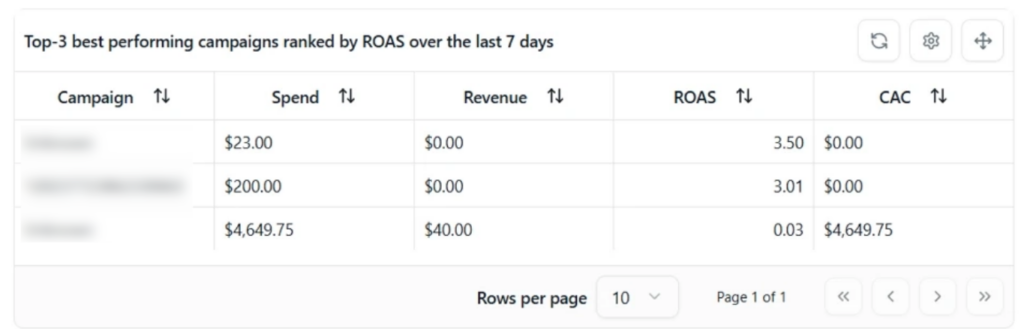
Tables
You can use these reports to analyze performance, compare results, and identify trends faster.
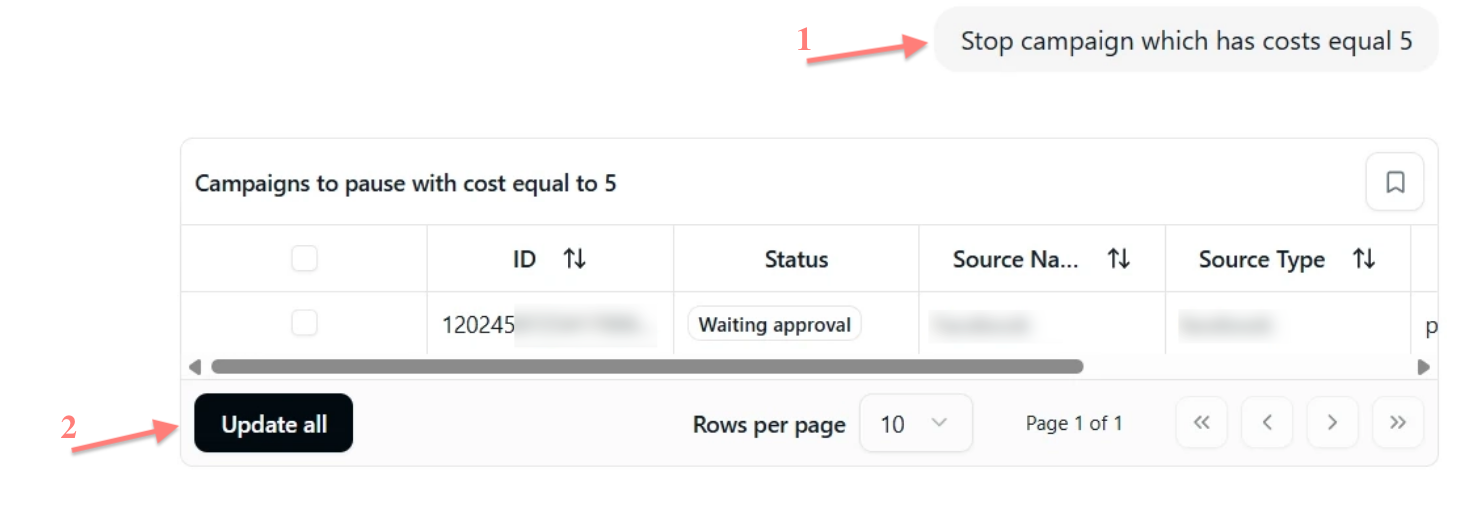
With the help of AI Copilot, you can easily adjust campaign statuses and budgets to boost performance:
1. Enter your request or command in AI Copilot.
2. Review the generated response.
3. Confirm the action by clicking Update all or Update selected.
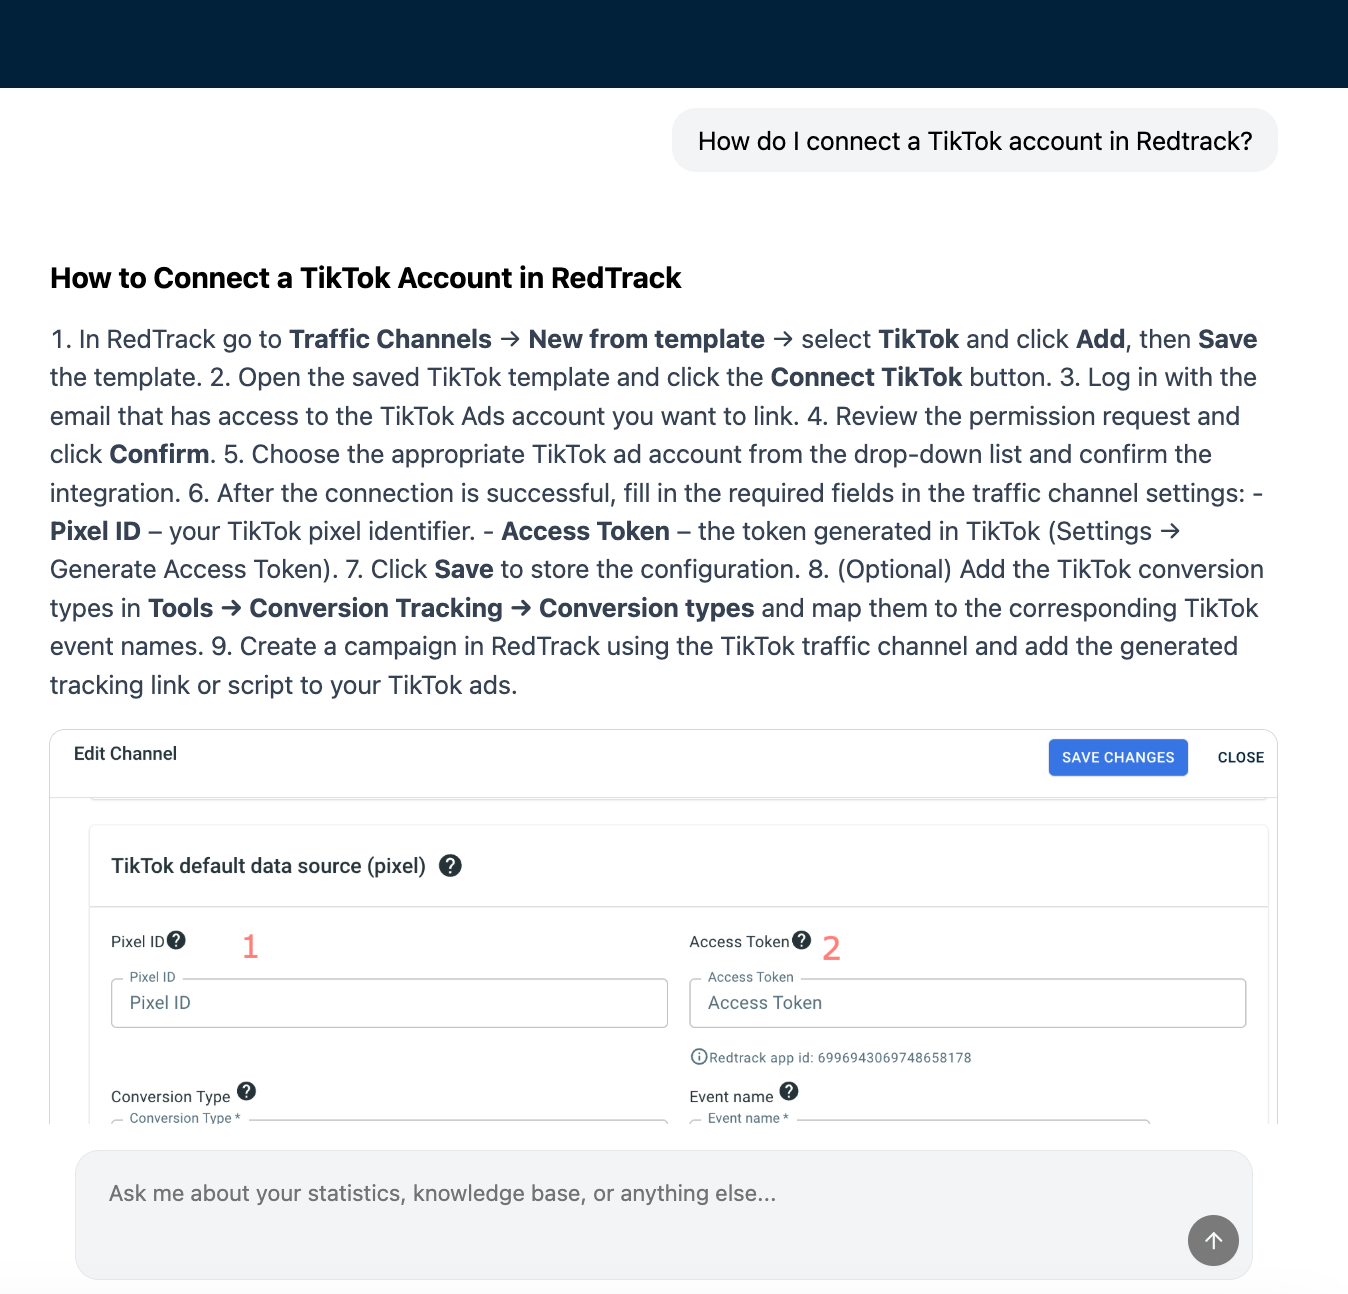
Copilot can guide you through RedTrack’s documentation and direct you to the most relevant guide based on your question or use case:
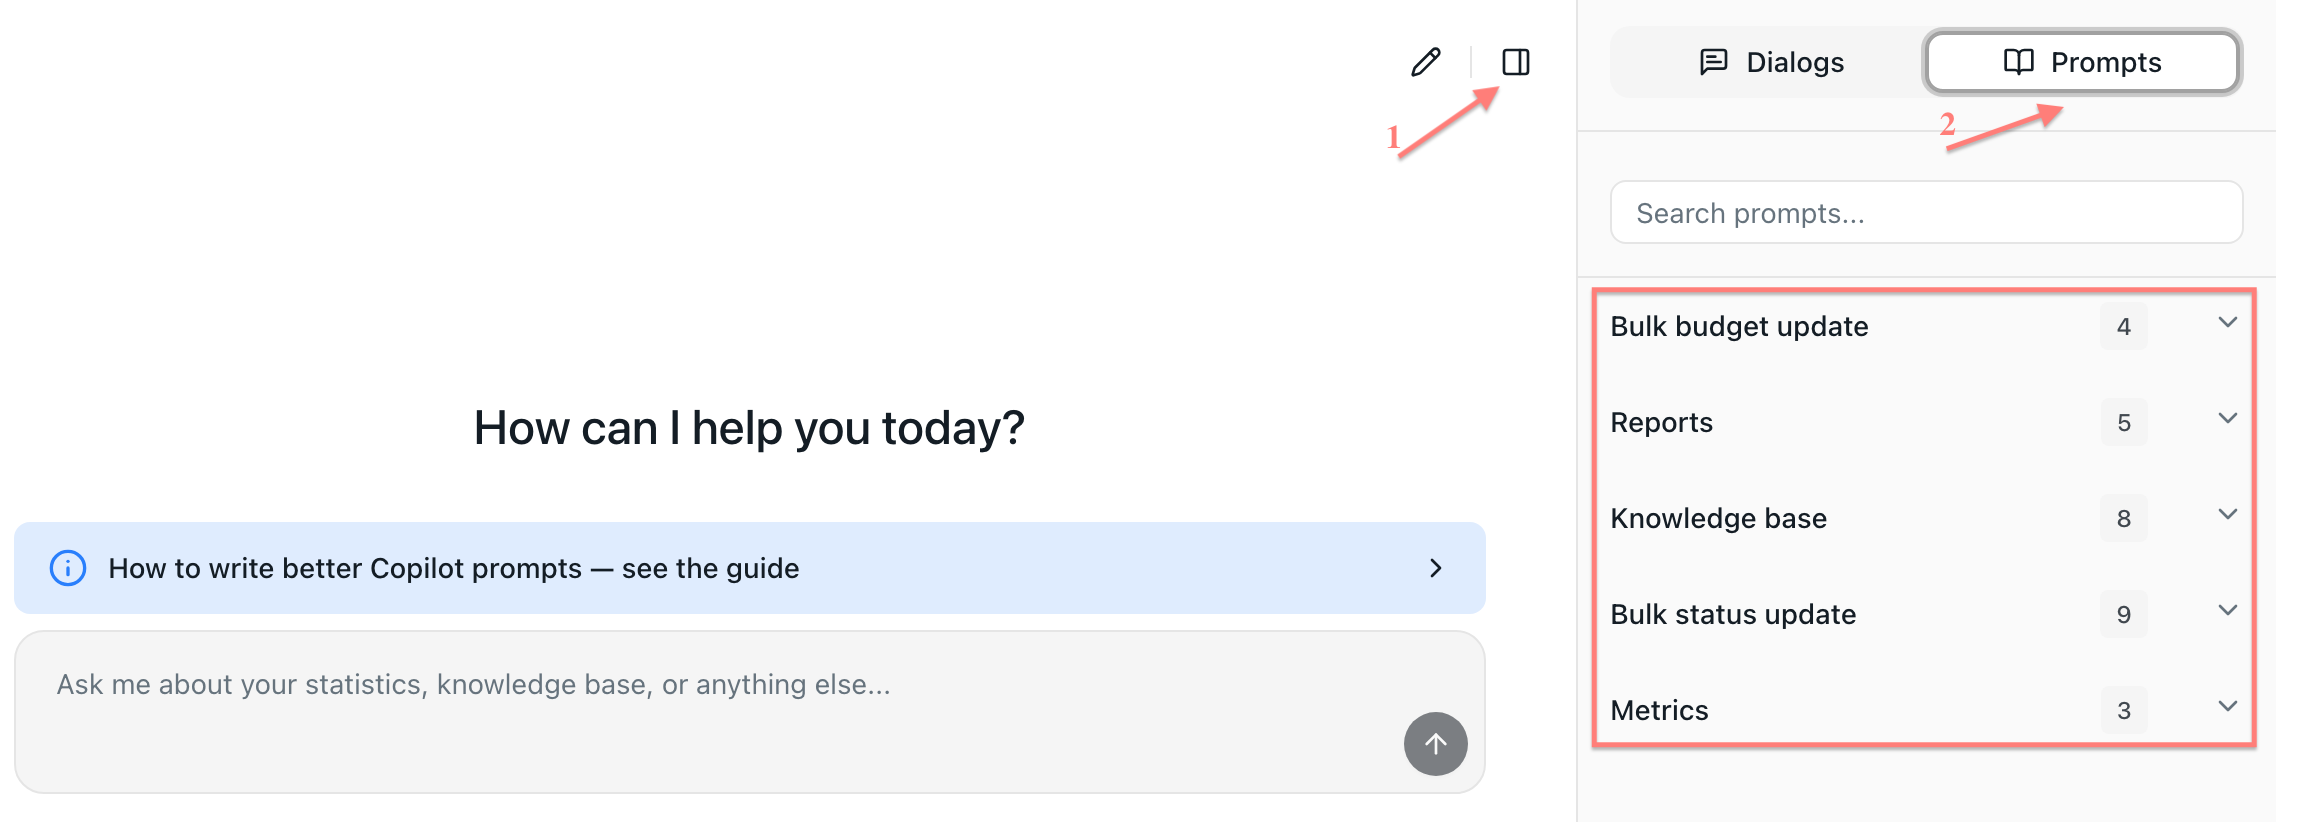
AI Copilot keeps your chat history and shows suggested prompts to help you continue working faster.
To view your previous interactions with AI Copilot or access available prompt suggestions, click the history icon → Dialogs or Prompts: