Reporting: columns
What are Columns in RedTrack?
Columns in RedTrack is our analytical data processing system. The Columns functionality in a report organizes and displays collected data, structuring it based on the selected data slice, thereby allowing for easier analysis and interpretation.
This table will show which reports/sections of the RT tool have columns and whether they are customizable:
Report/Section | Columns can be added/removed from/to the template lists (yes/no) | Possibility to add custom columns with metrics (yes/no) |
|---|---|---|
Ads Manager | Yes | Yes |
Automated rules | No | No |
Conversion path | No | No |
Reports:
| Yes | Yes |
Landers | Yes | Yes |
Logs:
| Yes | No |
Manipulations with columns
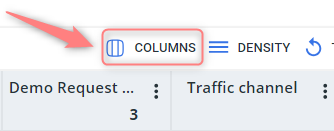
1. To access column settings press the Columns icon in the needed report/section:
2. Adjust columns as per your needs:
Remove/Add columns
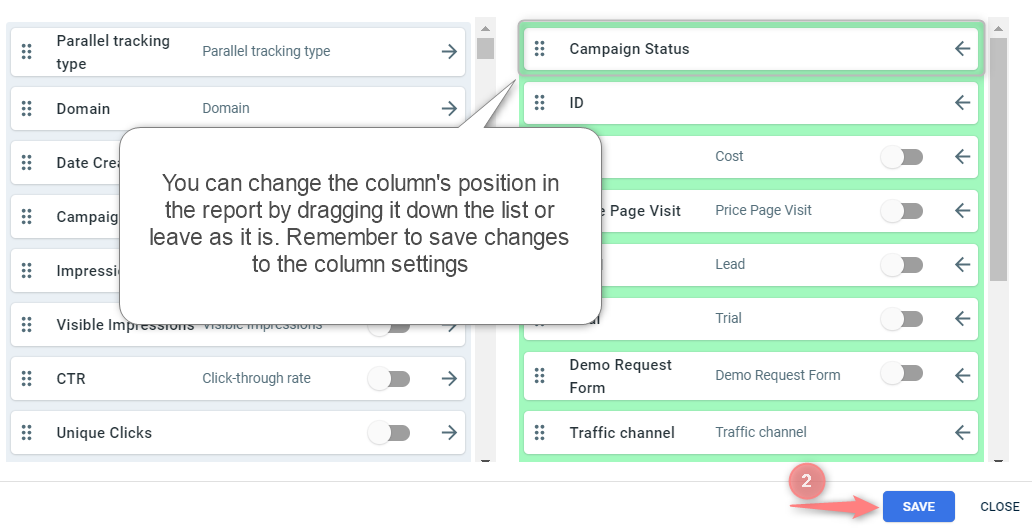
1. To add the column to the report go to the grey list of the columns on your left → press arrow next to it → Save changes to the column settings:

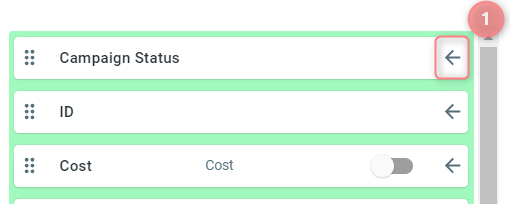
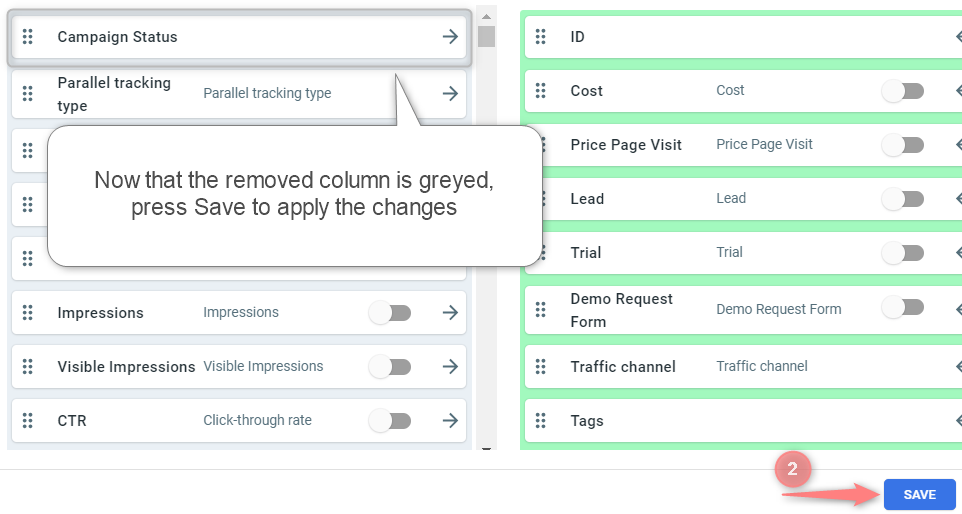
2. To remove the column from the report go to the green list of the columns on your right → press arrow next to it → Save changes to the column settings:
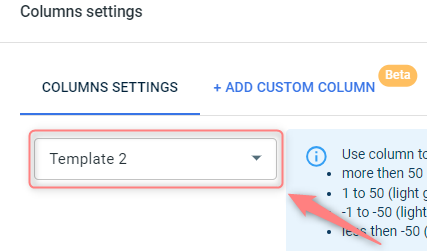
3. You can arrange the set of columns in templates for convenience. So far RT functionality allows you to collect 3 types of templates and all of them you can customize (add/remove/highlight the preferred columns) as per your needs:
Add custom columns
With the help of custom columns you can create and configure additional columns in a data table to suit your specific needs, enabling more personalized data organization and analysis.
To add a custom column:
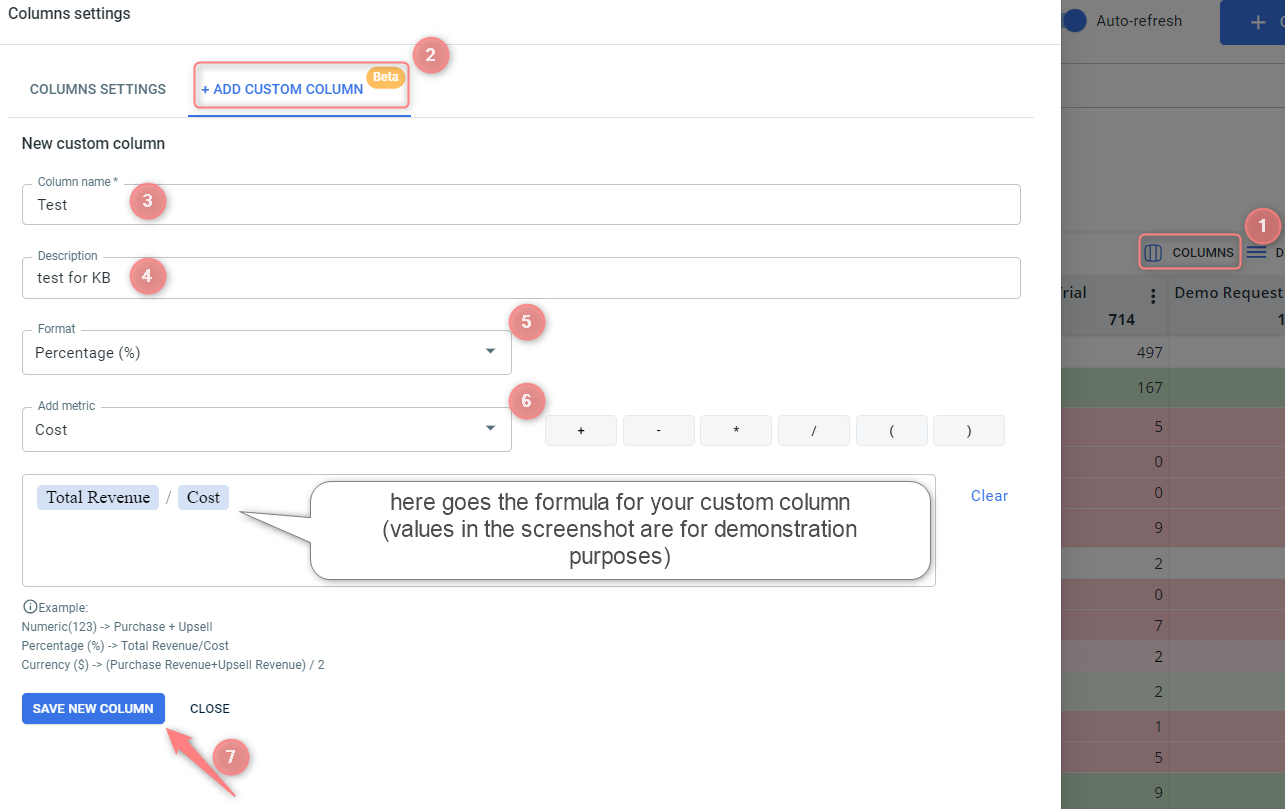
1. Go to Columns → Add custom column → fill in the mandatory fields → enter the formula for your custom column → Save new column:
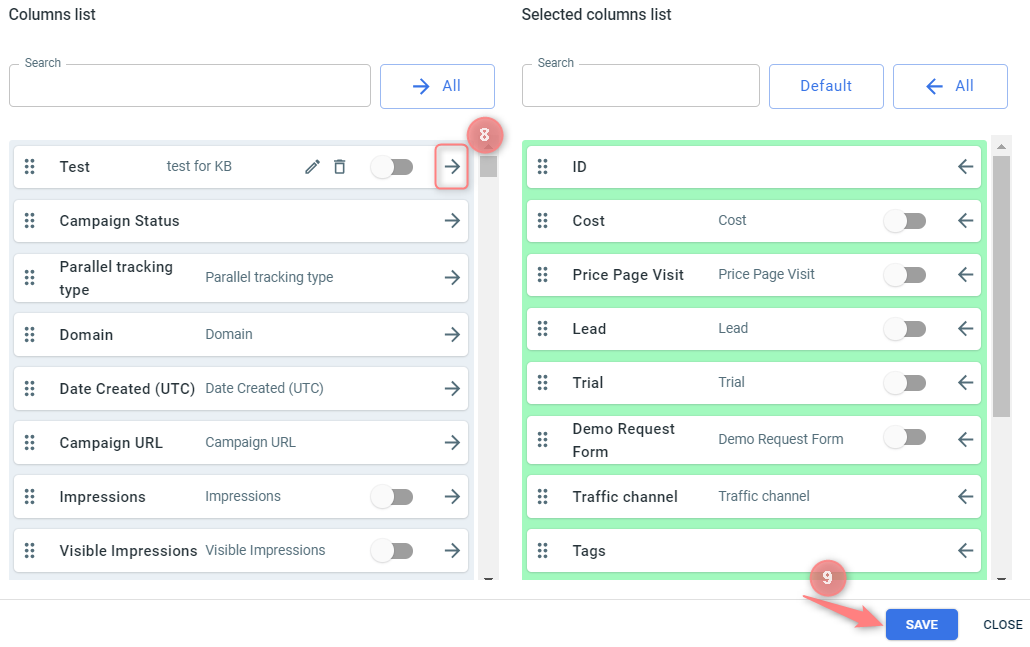
2. Once it’s created it’ll be added to the grey list of columns, add this column to the green list of columns (active columns) → Save column settings to apply the changes to the report table:
Highlight columns
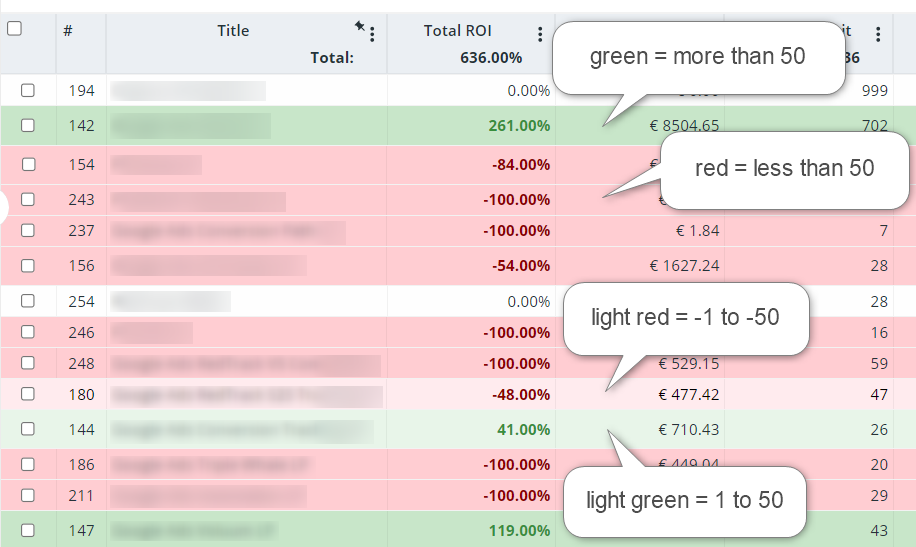
RedTrack functionality allows you to highlight certain rows based on the chosen column value. It can be done in 2 ways (choose the preferred one):
To highlight rows via Toggles go to the needed report/section → columns settings → identify the preferred value for the system you need to switch on the toggle in the chosen column.
Example: You decided to turn on the Total ROI toggle:
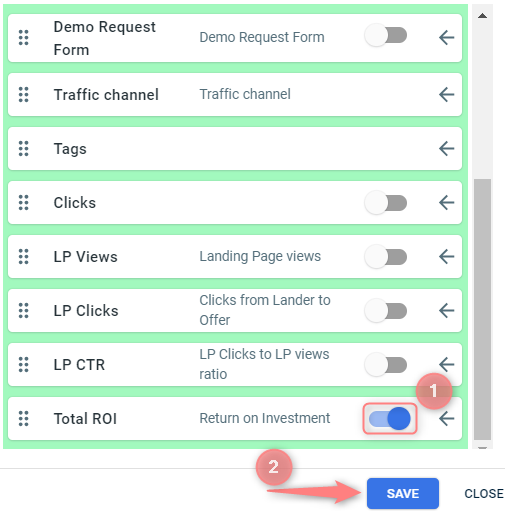
So now your report is highlighted based on the Total ROI data:
For example: you turned on the Cost toggle for Campaigns report, so your rows will be highlighted based on the cost data in the Campaigns report. Then you went to the Offers report and turned on the Total ROI toggle, so your rows will be highlighted based on the total ROI data in the Offers report.
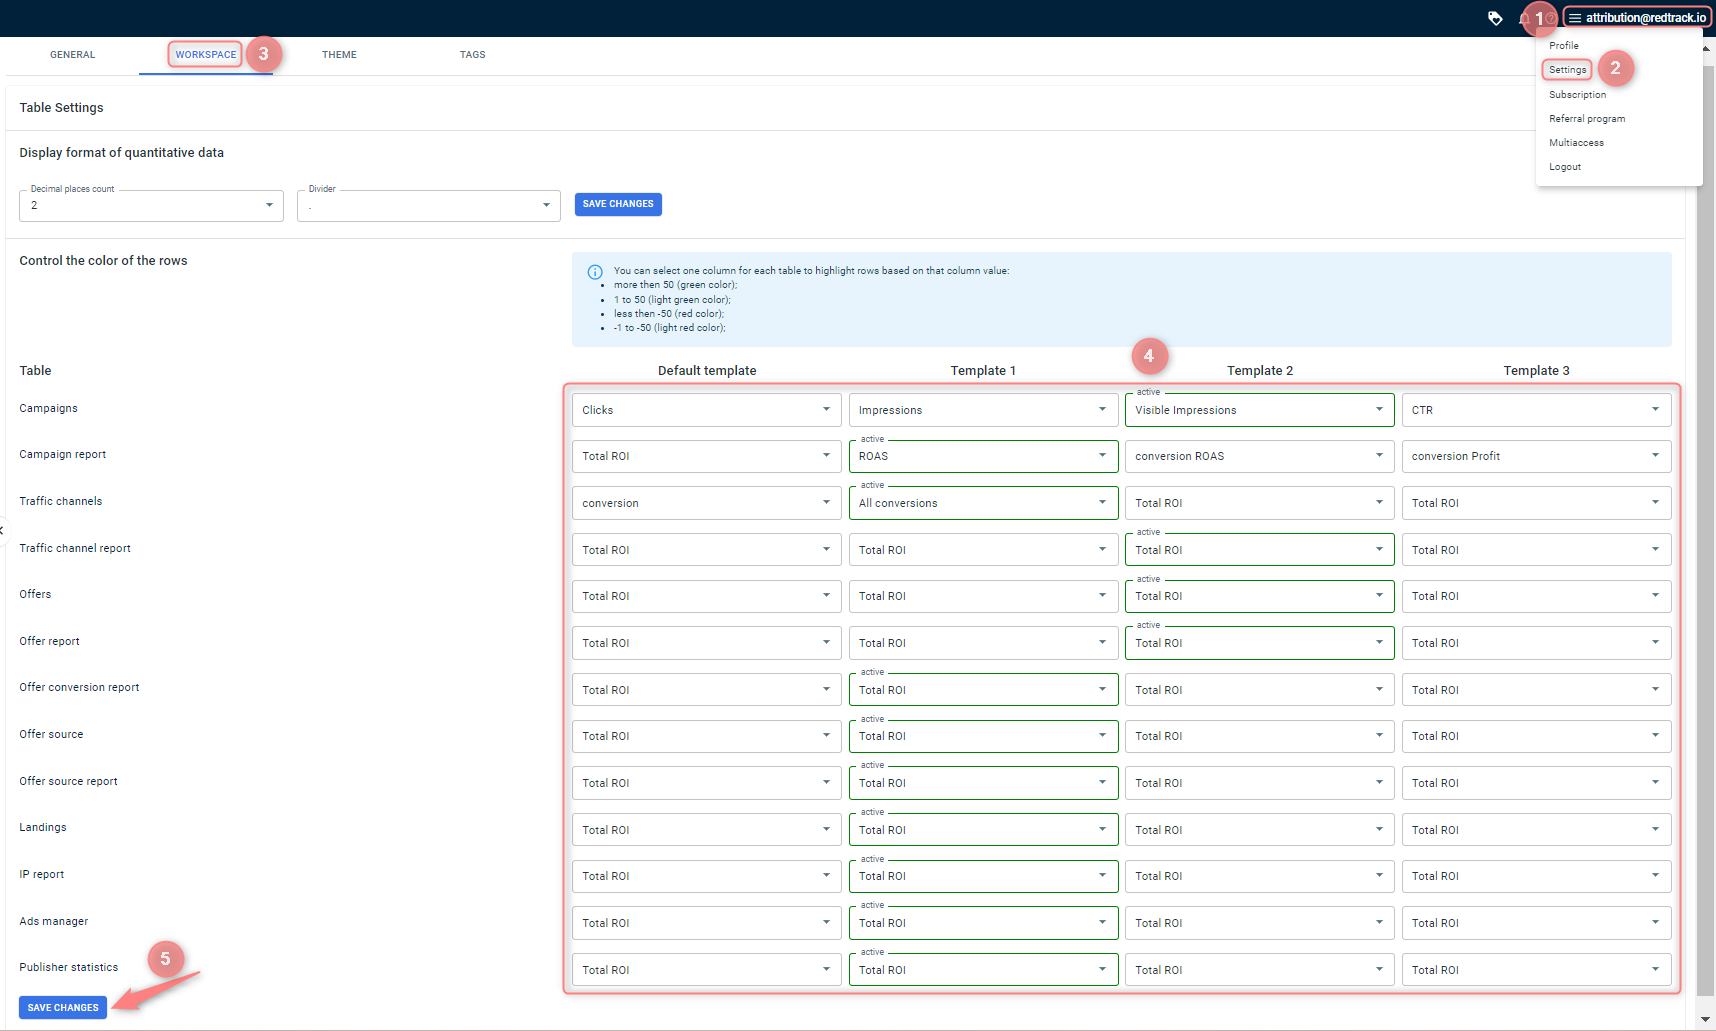
To manage the highlight of rows and set them up for all the reports and templates in one place go to burger menu → Settings → Workplace → Control the color of the rows → next to each report choose the preferred value based on which the rows will be highlighted → Save changes:
Customize the quantitative data format
To change the format of the displayed data go to burger menu → Settings → Workspace → choose the quantity of numbers after the divider → select the needed divider (dot or comma) → Save changes:

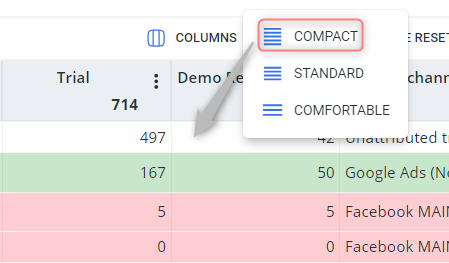
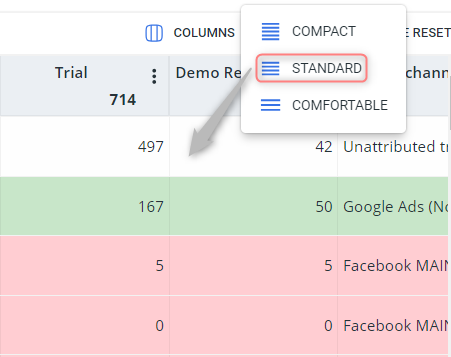
Change columns overview
To adjust the table layout:
1. Press the Density button in the chosen report:
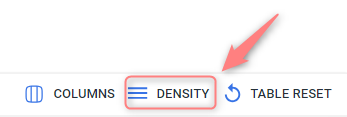
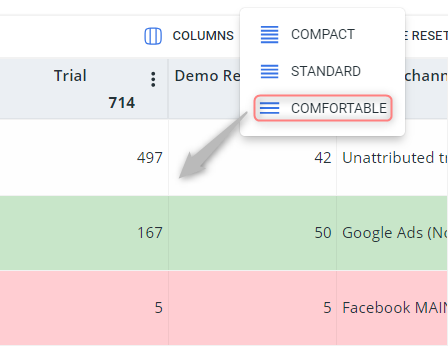
2. Set the preferred mode:
- Compact:
- Standard:
- Comfortable:
